Outflows from U.S. spot Bitcoin ETFs, or exchange-traded funds, surpassed $706 million this week as bears pushed Bitcoin to $53,304 — its lowest level since Aug. 5.
According to data from SoSoValue, the 12 spot Bitcoin ETFs logged $169.97 million in net outflows on Sep. 6, with Grayscale and Fidelity leading the pack.
- Fidelity’s FBTC shed $85.5 million, with the fund experiencing negative flows for the past seven trading days.
- Grayscale’s GBTC added to the exit liquidity, with $52.9 million leaving the fund, bringing total losses to over $20 billion since its inception. Over the past eight days, the fund has lost $279.9 million, continuing its outflow streak since Aug. 27.
- Bitwise’s BITB saw outflows of $14.3 million
- ARK 21Shares’ ARKB, $7.2 million
- Grayscale’s Bitcoin mini trust, $5.5 million
- Valkyrie’s BRRR, $4.6 million
BlackRock, WisdomTree avoid outflows
BlackRock’s IBIT and WisdomTree’s BTCW were the only Bitcoin ETFs that avoided outflows over the past week. However, they recorded no new inflows in the last two days.
This investor hesitancy coincides with Bitcoin’s recent dip. The bellwether crypto was back up to $54,333 at the time of writing after briefly touching $52,690—its lowest point since Aug 5. Yet BTC was down 3% over the past day.
Bitcoin is down 10.4% from its weekly high and 17.5% from its 30-day peak of $64,648, reached on Aug. 26. The turbulence intensified over the past 24 hours as $113.86 million in Bitcoin positions were liquidated, according to Coinglass.
Bitcoin’s price drop came amid growing unease in the crypto market, fueled by what is dubbed the “Redtember” seasonal slump and uncertainty over potential U.S. interest rate cuts. These factors dampened investor confidence and glorified market volatility.
According to data from Alternative, the widely monitored Crypto Fear and Greed Index still stands at 23, its lowest level in over a month. This indicates high investor anxiety and a risk-averse market environment.
Further downside expected
Technical indicators suggest that a death cross could form soon, with the 50-day and 200-day Exponential Moving Averages nearing a crossover. Death crosses are one of the most feared patterns in technical analysis. Bitcoin plummeted more than 67% after forming a death cross in January 2022.
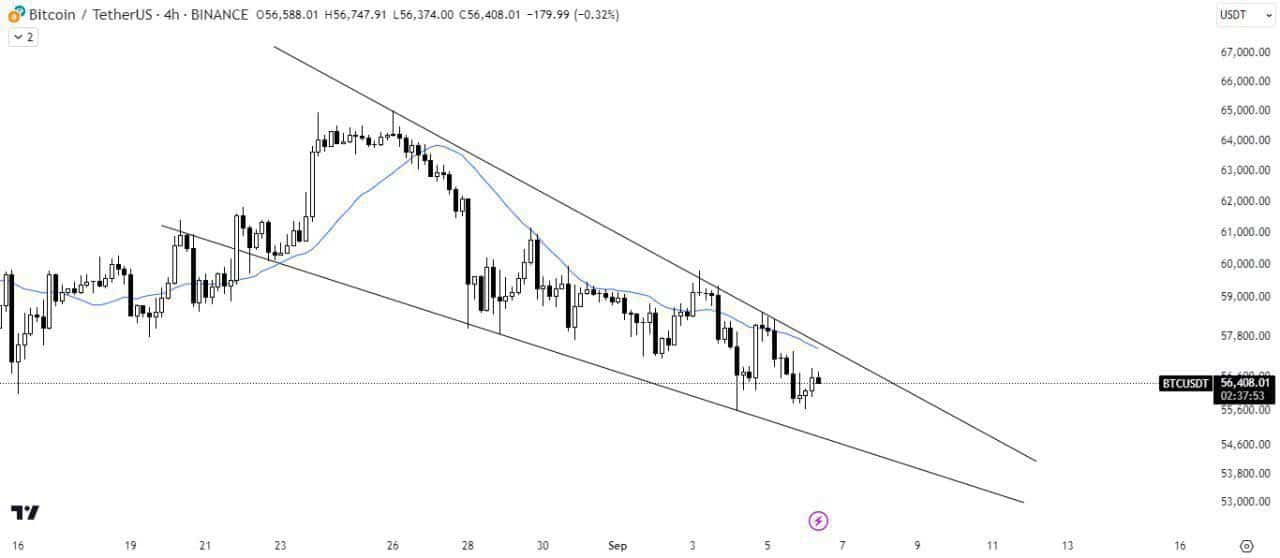
Analysts on social media platform X also maintained a bearish outlook. According to crypto analyst Pushpendra Singh Digital, BTC is stuck in a falling wedge pattern.
He suggests a breakout above the wedge around the $57,800 to $58,000 range could lead to a strong upward move.
However, if BTC drops below the support trendline around $54,000, it could lead to further downsides.

Echoing this cautious sentiment, a 1D BTC/USDT chart shared by Crypto analyst Nika also highlighted Bitcoin’s struggle to climb above the $58,000 level.
If the cryptocurrency fails to clear this resistance zone, it could face a more significant downward path, with potential support levels at $45,000 and $42,000.


