
Reason to trust
Strict editorial policy that focuses on accuracy, relevance, and impartiality
Created by industry experts and meticulously reviewed
The highest standards in reporting and publishing
Strict editorial policy that focuses on accuracy, relevance, and impartiality
Morbi pretium leo et nisl aliquam mollis. Quisque arcu lorem, ultricies quis pellentesque nec, ullamcorper eu odio.
Bitcoin (BTC) is trying to reclaim a crucial area amid its recent price recovery, which could propel the flagship crypto toward new highs. Some analysts suggested that BTC is preparing for the “final resistance,” while others warned that it still risks a potential pullback to lower levels.
Related Reading
Bitcoin Rally Eyes Next Resistance
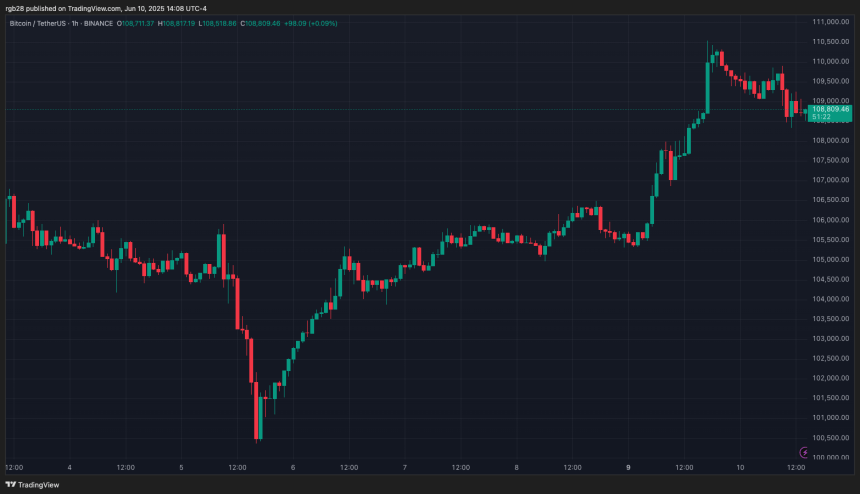
Bitcoin has finally regained significant bullish momentum after printing a massive daily candle on Monday. The flagship crypto recently lost its post-all-time high (ATH) range of $106,800-$109,700, sparking concern among some investors.
Amid the recent market pullbacks, which began in late May, the flagship crypto also registered some volatility, losing key levels as support and hitting a one-month low near the $100,000 level last week.
However, BTC reclaimed the $105,000 mark over the weekend before surging above the $106,800 crucial resistance on Monday. Following this performance, analyst Rekt Capital stated that Bitcoin has successfully retested the $104,400 re-accumulation range high resistance as new support for four weeks.
He highlighted that BTC was “rebounding from this new support base in an effort to transition into Price Discovery again.” Additionally, Bitcoin ended its two-week downtrend, recording a Daily Close around the $110,500 area.
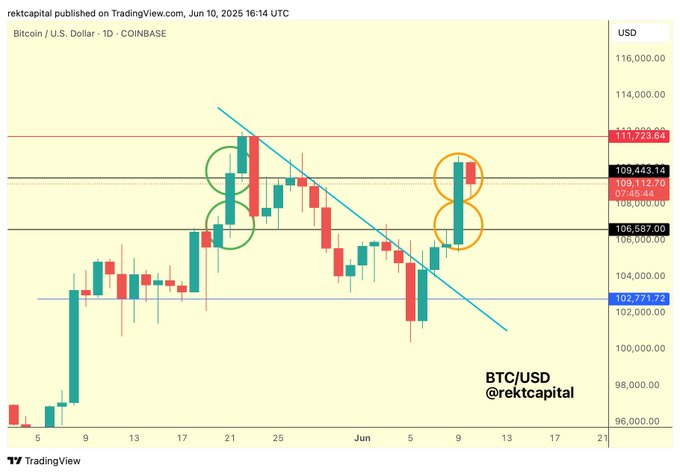
Per the analyst, BTC “has skipped through the $106,600-$109,443 Daily Range entirely,” and is “once again positioning itself like in late May for a retest” of the range’s high as support, which propelled the price to its ATH last month.
A daily close above the $109,443 level would set up BTC for a revisit of the “final Daily resistance,” around the $111,723 mark, before a new ATH. The analyst also affirmed that reclaiming the “final weekly resistance” of $108,900 as support would also add to BTC’s momentum.
BTC In A ‘Dangerous Area’?
Analyst Crypto Jelle suggested that turning the $108,000 price area into support could send Bitcoin to the price discovery phase, potentially targeting the $120,000 mark. He noted that previous unsuccessful breakout attempts failed to reclaim this level, but that the cryptocurrency is currently holding this area.
Based on a multi-month pattern, Jelle also reaffirmed its $140,000-$150,000 target for BTC’s cycle top. The analyst highlighted a major inverted Head and Shoulders pattern forming since the end of 2024.
According to the post, the pattern is “nearing completion” after the recent price drop formed the right shoulder, while the neckline sits around the $111,000 mark. A breakout above this level could send Bitcoin to Jelle’s cycle top target.
Related Reading
Altcoin Sherpa considers that BTC’s chart “looks pretty good” in the high-time timeframes, suggesting that he will be “bullish until shown otherwise.” However, he warned that Bitcoin is “still in a dangerous area” as it could drop to lower levels if it doesn’t reclaim the $110,000 level.
To Sherpa, “it’s logical to assume some sort of pullback is going to come in the red supply zone,” which sits between the key resistance line and its ATH level. Meanwhile, Ali Martinez highlighted on X that BTC’s most important support area sits between the $102,770 and $106,090 levels, where 2.21 million addresses bought 1.39 million BTC.
As of this writing, Bitcoin trades at $109,995, a 3.6% increase in the weekly timeframe.
Featured Image from Unsplash.com, Chart from TradingView.com


