
Bitcoin (BTC) eyed weekend highs into Sunday’s weekly close with the yearly candle in focus.
Key points:
-
Bitcoin sees an eerily calm weekend as analysis eyes a three-day bullish divergence locking in.
-
It may take until the new year for capital to redeploy and the BTC price situation to change.
-
Bitcoin is down 6% for the year, potentially marking a bearish post-halving record.
New year could bring $100,000 BTC price
Data from TradingView showed BTC price action nearing $88,000 after two days of barely any volatility.
Friday had seen familiar fakeout moves as liquidity hunts accompanied a record $24 billion options expiry event. As Cointelegraph reported, this was thought to be acting as a suppressing force on price.
Now, bullish arguments included a key relative strength index (RSI) divergence on three-day timeframes.
“Bitcoin locked in a three-day bullish divergence, right on top of key support,” trader Jelle wrote in an X post on the topic.
“The previous two bottoms formed with 3-day divergences as well. Time for history to repeat?”
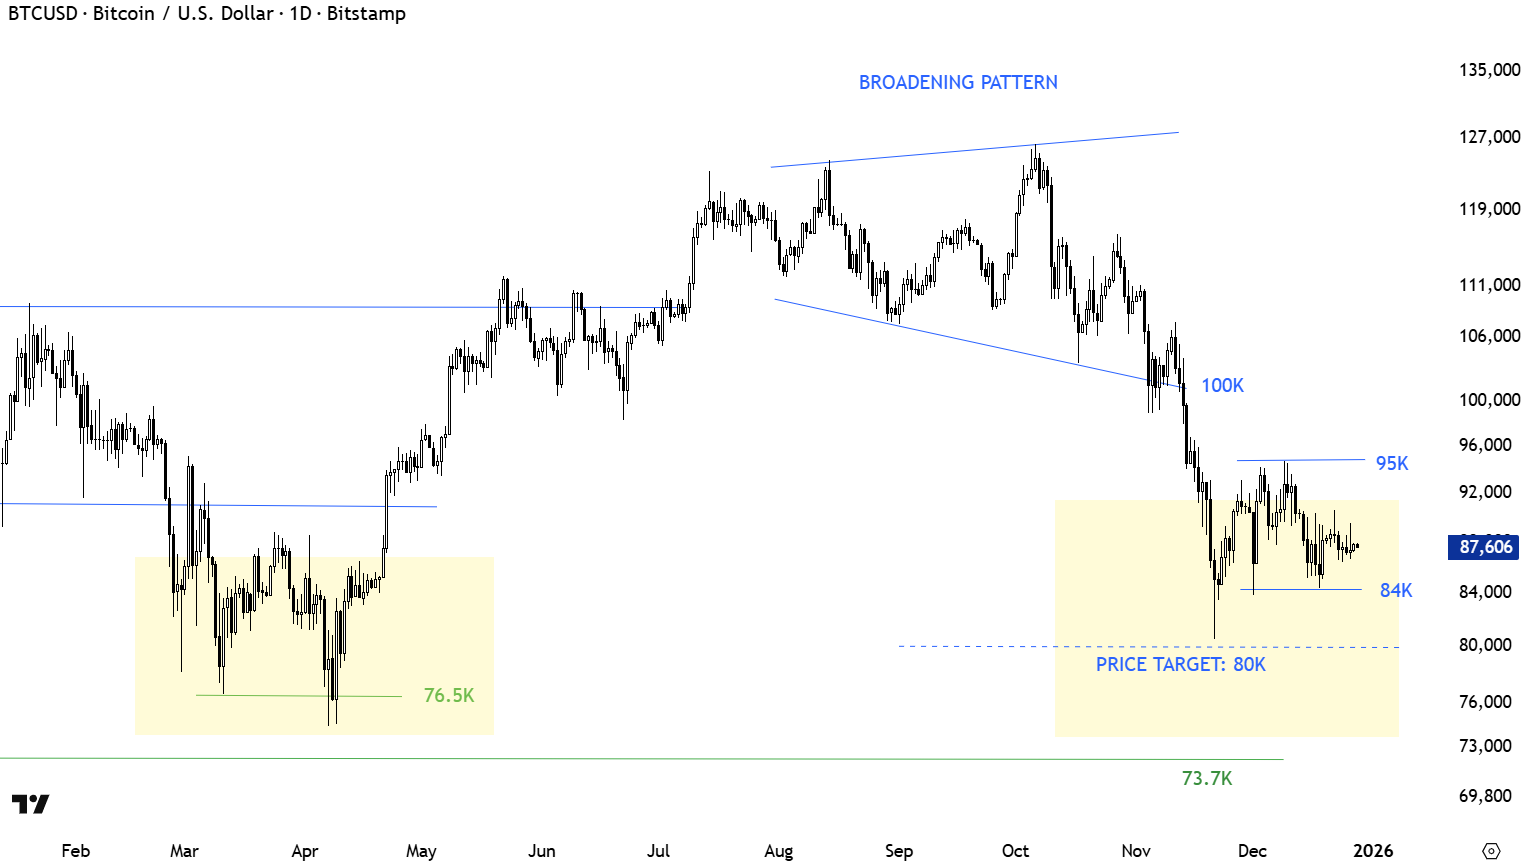
Trader BitBull put faith in seasonality when it came to a BTC price rebound. Institutions, he argued, would begin allocating capital to “underperforming assets” in early January.
“This could trigger a breakout from this trendline and a move towards $100K will happen,” he predicted Friday.
$BTC has probably 5-6 days of sideways price action left.
As 2025 ends, this is what going to happen:
– Those who sold at a loss for tax harvesting will buyback BTC
– Investors will allocate into underperforming assets in Jan 2026 as they always do.
This could trigger a… pic.twitter.com/3NejU5j2do
— BitBull (@AkaBull_) December 26, 2025
Trader and analyst Aksel Kibar was unsurprised by Bitcoin’s range-bound behavior and lack of volatility given the sharp upside during Q3.
“Volatility is cyclical,” he told X followers.
“High volatility is now followed by low volatility until we find a clean chart pattern setup to capitalize on.”
Bitcoin yearly candle challenges four-year cycle
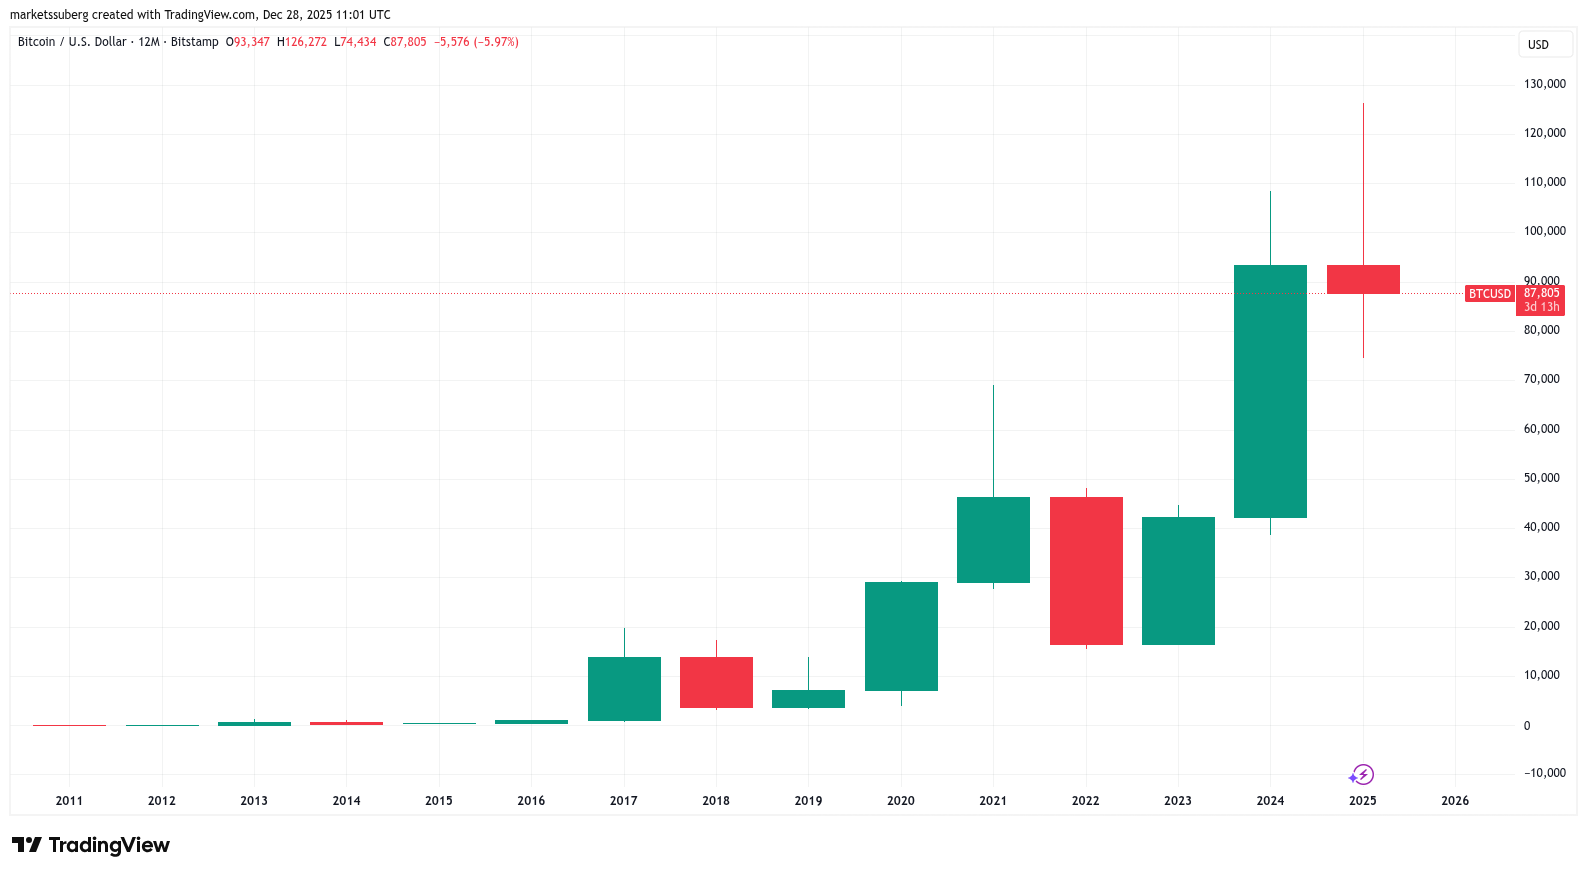
With days to go until the 2025 yearly candle close, Bitcoin still risked making bearish history.
Related: Bitcoin ETFs lose $825M in five days as US becomes ‘biggest seller’ of BTC
Currently down 6.1% year-to-date, BTC/USD was on track for its first “red” post-halving year in history.
This led some to argue that the concept of BTC price action moving in four-year cycles no longer matched reality.
Bitcoin has 4 days left to close the yearly candle green
If it closes in red then it would be the first in 14 years for a 3rd bull-market year….signaling a structural shift and breaking the 4-year cycle thesis pic.twitter.com/JjQ8QVtC6f
— Ajay Kashyap (@EverythingAjay) December 27, 2025
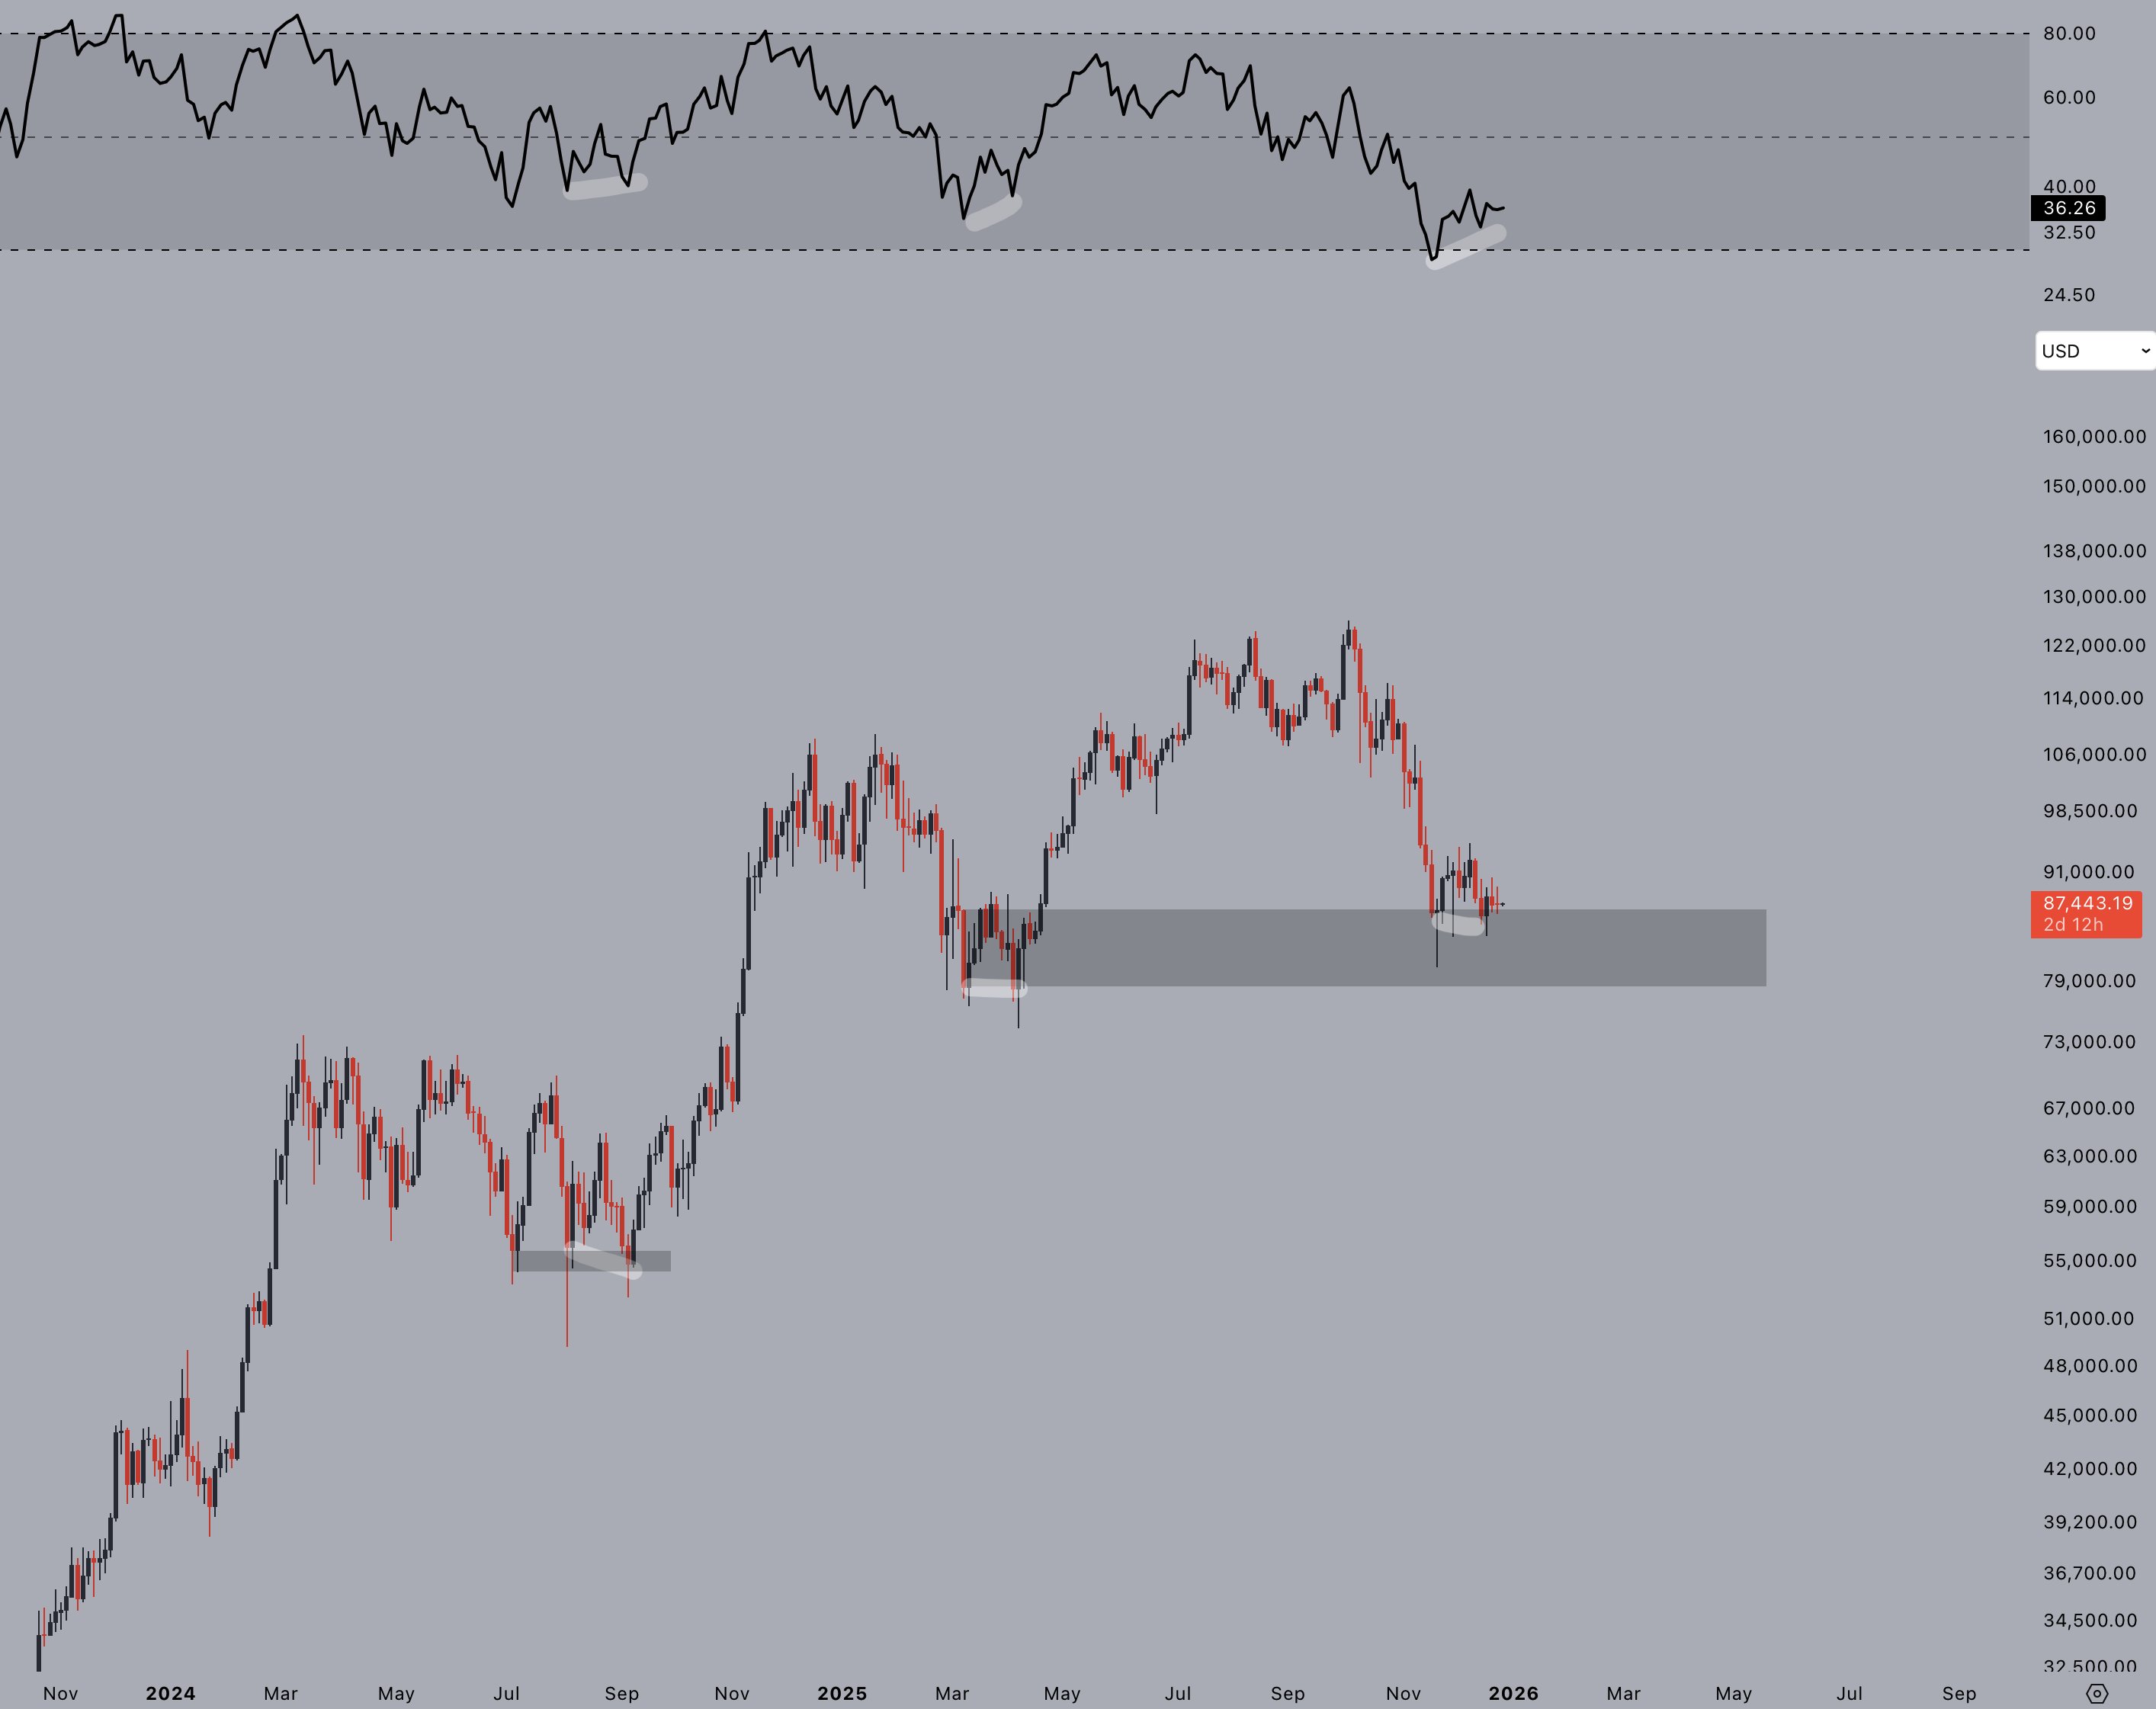
Keith Alan, cofounder of trading resource Material Indicators, suggested that the yearly candle’s color would be of major importance.
“Wicks beyond key levels are to be expected – it’s closes that matter most,” he wrote on Christmas Day alongside a chart from one of Material Indicators’ proprietary trading tools.
“Keeping with the holiday spirit, I’m most interested in whether or not we see a red or green candle to close Q4 and the Year, and I’ll be looking for new macro insights from Trend Precognition at the January open.”
Alan said that the yearly open around $93,500 could still come in for a last-minute retest.
This article does not contain investment advice or recommendations. Every investment and trading move involves risk, and readers should conduct their own research when making a decision. While we strive to provide accurate and timely information, Cointelegraph does not guarantee the accuracy, completeness, or reliability of any information in this article. This article may contain forward-looking statements that are subject to risks and uncertainties. Cointelegraph will not be liable for any loss or damage arising from your reliance on this information.
This article does not contain investment advice or recommendations. Every investment and trading move involves risk, and readers should conduct their own research when making a decision. While we strive to provide accurate and timely information, Cointelegraph does not guarantee the accuracy, completeness, or reliability of any information in this article. This article may contain forward-looking statements that are subject to risks and uncertainties. Cointelegraph will not be liable for any loss or damage arising from your reliance on this information.


