
Reason to trust
Strict editorial policy that focuses on accuracy, relevance, and impartiality
Created by industry experts and meticulously reviewed
The highest standards in reporting and publishing
Strict editorial policy that focuses on accuracy, relevance, and impartiality
Morbi pretium leo et nisl aliquam mollis. Quisque arcu lorem, ultricies quis pellentesque nec, ullamcorper eu odio.
While Bitcoin continues to hover above the $100,000 threshold, the driving forces behind this historic consolidation phase appear to be more complex than the surface-level narratives of institutional “FOMO” and ETF euphoria. According to multiple leading analysts, a silent rotation is underway—one that suggests long-term holders are offloading their positions while corporate treasuries and institutional buyers quietly absorb the flood.
OG Bitcoin Whales Are ‘Dumping’ On Wall Street
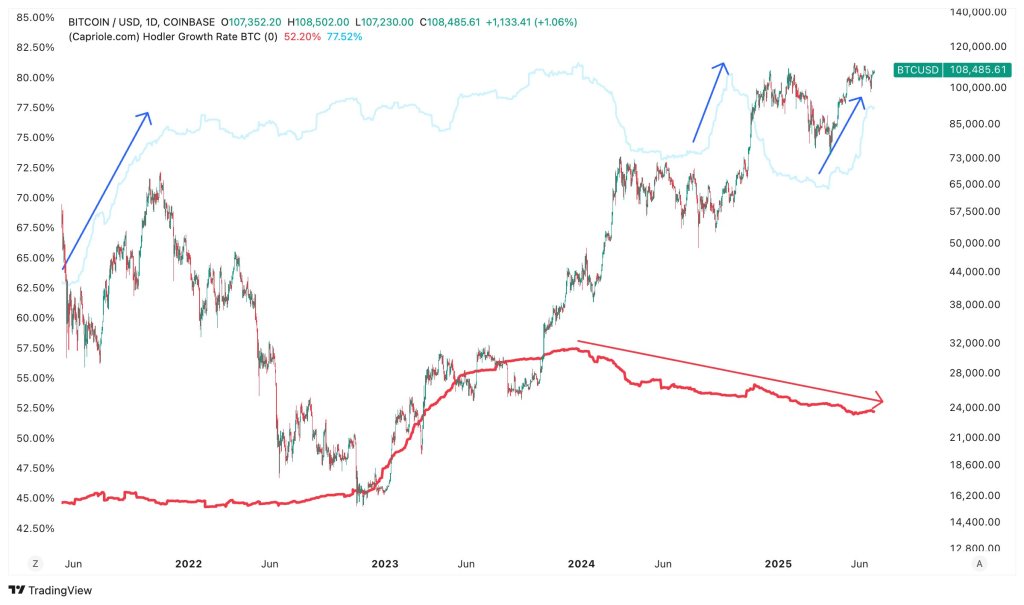
Charles Edwards, founder of Capriole Investments, delivered a sobering breakdown via X on June 29, challenging the prevailing belief that Bitcoin’s price stagnation amid surging demand is anomalous. “People are wondering why BTC has been stuck at $100K so long, despite the institutional FOMO,” he wrote. “Despite what X news might suggest, it’s because Bitcoin OGs (long-term holders) have been dumping on Wall St since the ETF Launch in January 2024, unloading their positions.”
Edwards, known for blending on-chain metrics with macro frameworks, pointed to a visible dynamic shift that is now being captured in blockchain data. While older coins are being redistributed, a newer class of holders—primarily treasury-oriented entities—are stepping in aggressively. “We have clearly entered the heat of [the Treasury Company] trend today as many copy-cats have entered the market,” he said, referencing his earlier prediction on Bits and Bips that corporate adoption would eventually eclipse ETF inflows in relevance.
What makes this transition particularly remarkable is the data behind it. Edwards highlighted that 6-month-plus BTC holders—commonly associated with more strategic, non-speculative accumulation—have skyrocketed in the past two months. “The amount of BTC acquired in the last 2 months by this cohort has completely consumed all of the BTC unloaded by LTHs over the last 1.5 years,” he said. “Incredible.”
Related Reading
This cohort’s aggressive accumulation, he added, has historically preceded bullish squeezes. “Whenever aggressive spikes in 6M+ holders occur, price usually squeezes following these periods. Short-term bullish,” Edwards remarked. However, he tempered the optimism by cautioning that broader on-chain data still signals fragility. “If the 6M+ holders (Treasury Companies) can continue their relentless buying, that should be achievable,” he noted, signaling that the flywheel has momentum, but is not yet immune to systemic pressure.
Adding another layer to this developing narrative, Mauricio Di Bartolomeo, Co-founder and CSO at Ledn, offered an alternative theory. He suggested that what appears as two flows—LTHs selling and Treasury entities buying—might in fact be “the same trade.” He wrote, “Long term holders [are] selling spot to buy ETFs/BTC Treasury Cos. Even though that feels unnatural for us bitcoiners.” Di Bartolomeo framed the shift as generational, pointing out that many early adopters may simply be more comfortable in traditional financial custody rather than self-sovereign wallets.
Related Reading
But Edwards pushed back on that explanation, arguing that if ETF migration was driving the reclassification of long-term holders, it would be evident across multiple aging cohorts. “I don’t think so because we would have seen a similar uptrend over time in the 6M+ and 1Yr+ cohorts if that was the case,” he replied. “Some is definitely moving to equities, but it’s very typical of this stage of the Halving cycle to see LTH selling into profit.”
Why Bitcoin ETF Do Not Have A 1:1 Effect On Price
The apparent dissonance between rising demand and stagnant price has also prompted commentary from on-chain analyst TXMC, who warned that most observers misunderstand what actually sets Bitcoin’s price. “Bitcoin people grossly underestimate how little of the supply is actually setting the price every hour,” he wrote. He described Bitcoin’s fragmented market structure as a web of siloed exchanges, loosely synchronized through cross-exchange market-making. “Each location has its own liquidity and depth which vary wildly. A large market order can have an outsized effect depending on which exchange it is placed at, and which time of day.”
TXMC argued that while ETFs and institutional desks are accumulating large quantities of Bitcoin, much of this activity is routed through OTC desks that bypass order books entirely. “These actions do not affect the price in the same way,” he said. “The desks source their own liquidity, and only have to go into the books to fill the difference.”
This explanation may help reconcile why ETF inflows in the billions of dollars have failed to push BTC significantly higher. Edwards’ thesis aligns with this too, insofar as the ETF boom may be fueling redistribution rather than outright net demand. TXMC added: “Stop underestimating how many big entities are out there looking for exit liquidity.”
Despite growing bullishness in cohort composition, the real test lies ahead. Whether corporate treasuries and ETF managers can absorb the remaining exit waves of Bitcoin’s earliest holders remains to be seen. But if Edwards is right, the rotation may already be past its critical phase.
“The flywheel still has a long way to go,” Edwards concluded. And if history is any guide, these moments of consolidation amid redistribution tend to precede volatility—not follow it.
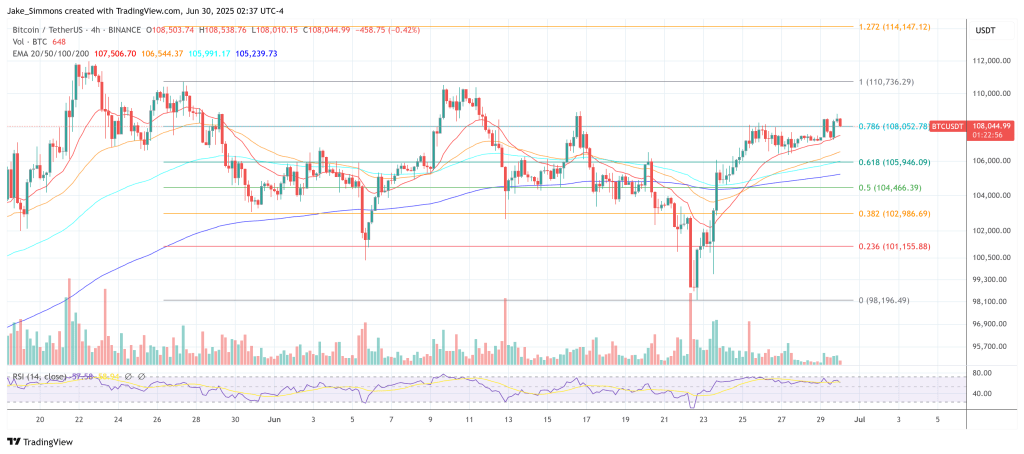
At press time, BTC traded at $108,044.
Featured image created with DALL.E, chart from TradingView.com