
Bitcoin (BTC) circled $85,000 into the March 23 weekly close as excitement over a key trend change brewed.
BTC/USD 1-hour chart. Source: Cointelegraph/TradingView
Bitcoin price meets decisive RSI setup
Data from Cointelegraph Markets Pro and TradingView showed BTC/USD finding strength during weekend trading.
Up 1.5% on the day, Bitcoin edged higher as part of a broad crypto market uptick, which also lifted various major altcoins.
“I think this next week will be telling where the market wants to head for the next higher timeframe move,” popular trader Daan Crypto Trades wrote in part of his latest X analysis, noting the closing position of CME Group’s Bitcoin futures.
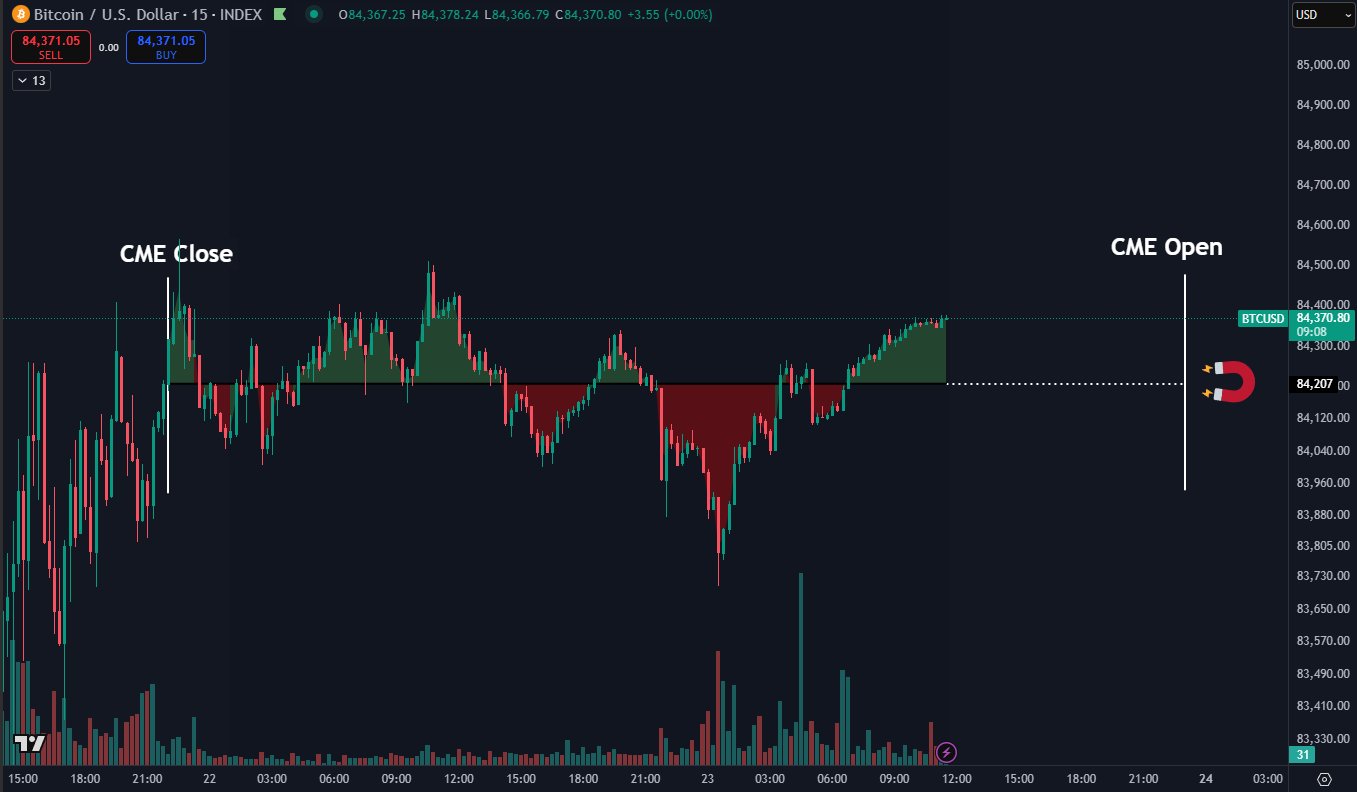
BTC/USD 15-minute chart. Source: Daan Crypto Trades/X
The post echoed the broader market sentiment as traders eyed the potential for a fresh push higher into the monthly close.
Popular trader and analyst Rekt Capital reiterated encouraging breakout signs on daily timeframes for Bitcoin’s relative strength index (RSI).
“The Daily RSI is showcasing early signs of retesting the Downtrend dating back to November 2024 as new support,” he reported.
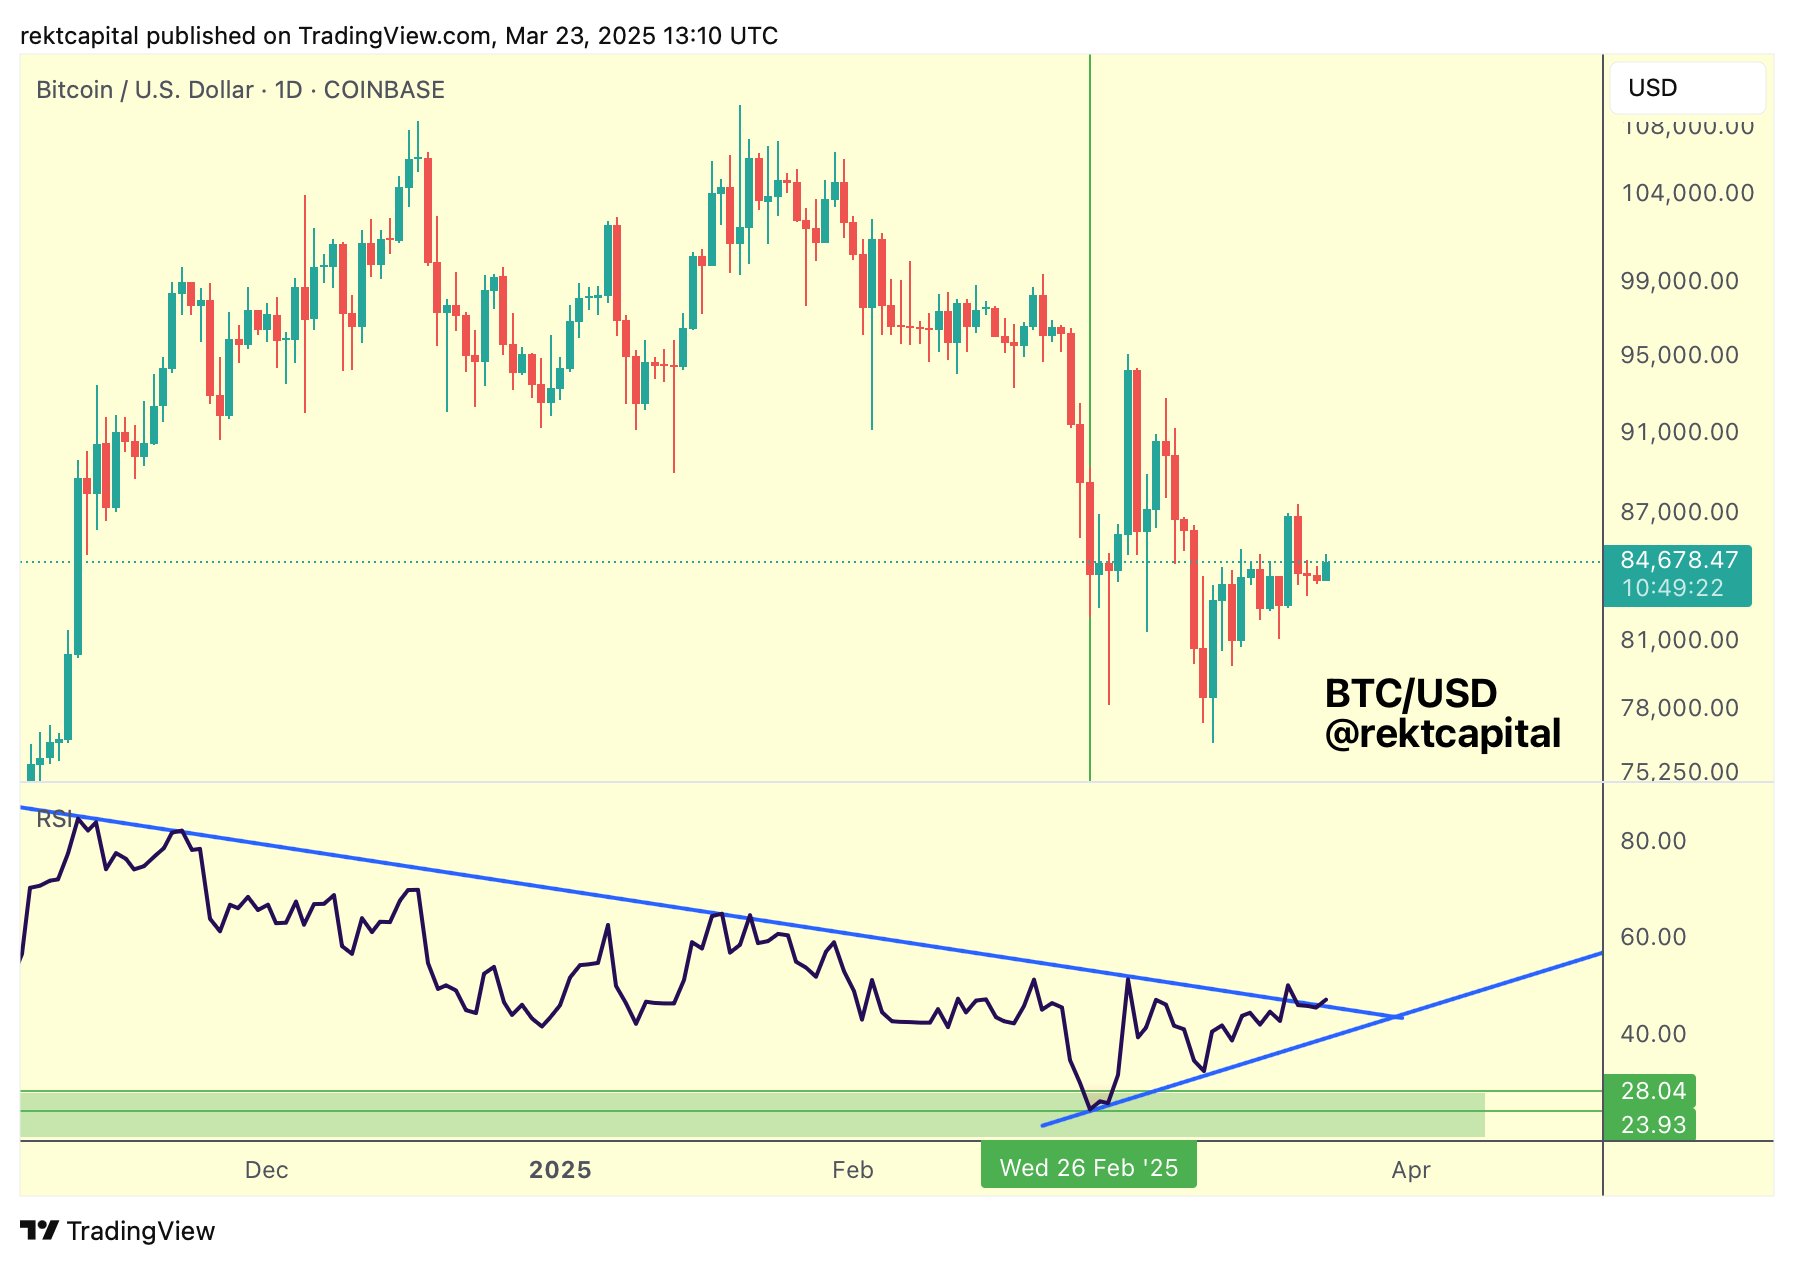
BTC/USD 1-day chart with RSI data. Source: Rekt Capital/X
For fellow analyst Matthew Hyland, however, current price levels held deeper significance.
For the first time in six months, he revealed on the day that BTC/USD was about to seal a key bullish RSI divergence on weekly timeframes.
“BTC can make weekly bullish divergence for the first time since September tonight,” he confirmed on X.
“Currently in position.”
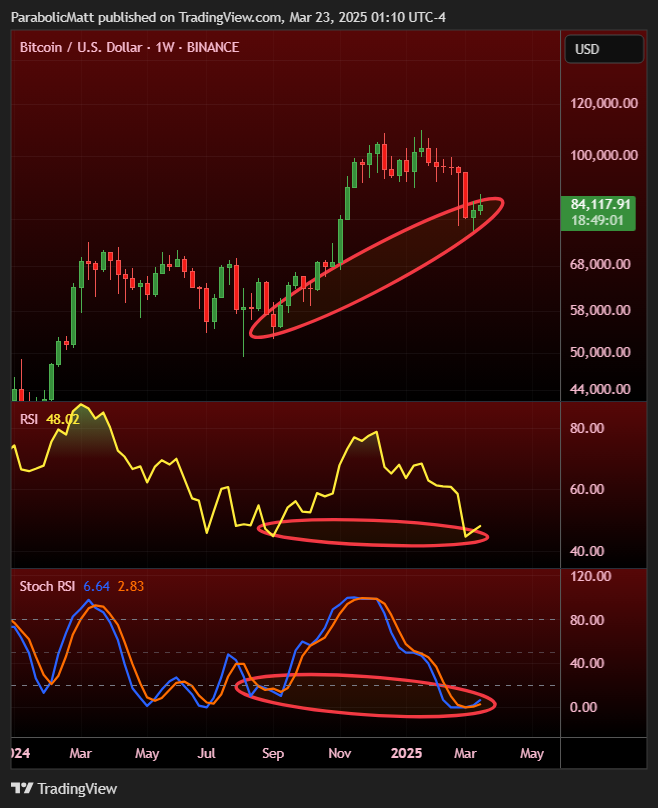
BTC/USD 1-week chart with RSI data. Source: Matthew Hyland/X
Bull market to return in “a couple of weeks?”
Elsewhere, trading team Stockmoney Lizards shrugged off the idea that Bitcoin risked entering a long-term bear market.
Related: Here’s why Bitcoin price can’t go higher than $87.5K
The local bottom, it told X followers in its latest market analysis, lay at $76,000 — a level already revisited earlier this month.
“While many are panicking and declaring a bear market, the long-term trend channel (green lines) remains firmly intact,” it summarized alongside a chart showing BTC price fluctuations around an average trend line during bull markets.
“This correction doesn’t invalidate the uptrend – it confirms it.”
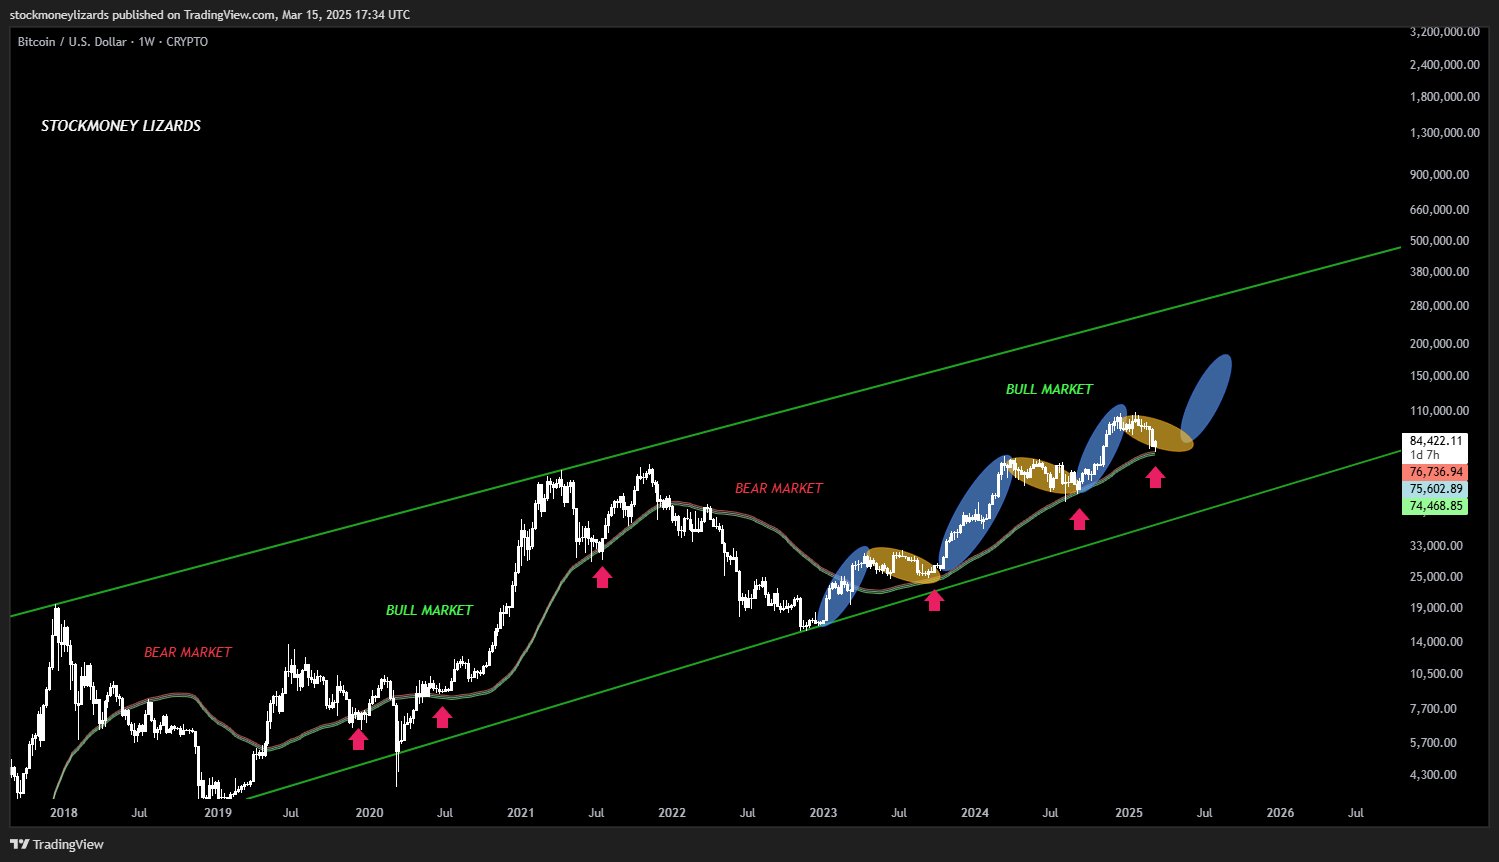
BTC/USD 1-week chart. Source: Stockmoney Lizards/X
Stockmoney Lizards acknowledged that upside continuation may take some time.
“This test doesn’t guarantee an immediate pump, but history indicates we’re approaching a bottoming zone,” it concluded.
“How long does this take? Well, nobody knows. These days, news, macroeconomic signals etc. can determine the duration of our correction. Educated guess: a couple of weeks.”
This article does not contain investment advice or recommendations. Every investment and trading move involves risk, and readers should conduct their own research when making a decision.

