Data shows investors in the Bitcoin market have turned greedy for the first time since March 2022, after what was the longest stretch of fear ever.
Bitcoin Fear And Greed Index Now Points At “Greed”
The “fear and greed index” is an indicator that tells us about the general sentiment among investors in the Bitcoin (as well as the wider crypto) market. To represent this sentiment, the metric uses a numeric scale that runs from 0-100.
All values below 50 imply a fearful market, while those above this threshold suggest greedy holders. Although this cutoff point might look clean in theory, in practice, the region between values of 46 and 54 is generally considered to belong to a “neutral” sentiment. Real breakouts towards fear or greed only take place when the metric crosses below or above this transition region.
There are also two other “special” sentiments: extreme greed and extreme fear. The former occurs above values of 75, while the latter happens under values of 25. The significance of these extreme sentiments is that tops and bottoms have historically tended to form when the investors have held these mentalities.
Because of this, some traders believe extreme fear periods provide ideal buying opportunities (as bottoms have taken place here), while times with extreme greed could be the best selling windows (since tops occur here).
A trading strategy called “contrarian investing” is based on a similar idea. As Warren Buffet said in his famous quote, “be fearful when others are greedy, and greedy when others are fearful.”
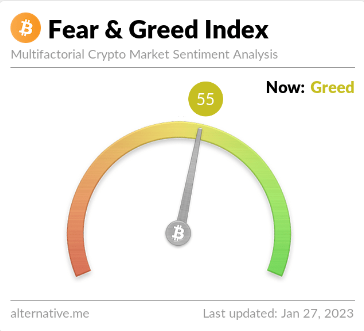
Now, here is how the current sentiment among Bitcoin (and wider crypto) investors looks like:
A greedy cryptocurrency sector | Source: Alternative
As can be seen above, the Bitcoin fear and greed index has a value of 55 right now, suggesting that the market has now properly entered into the greed zone. Before this break into the region, the sector had been in the fear region nonstop since March 2022, around ten months ago.
The below chart shows how the metric’s value has changed during the past year.
Looks like the metric has observed some growth in recent days | Source: Alternative
From the graph, it’s visible that the indicator had spent almost the entire past year not just in the fear zone, but actually all the way down in the extreme fear region. There was only one proper spike into greed during this period, and that was the aforementioned March 2022 instance. This previous surge had only lasted for a single day before the market became fearful again.
These continuous streaks of fear and extreme fear during the past year were both the longest runs in the history of the indicator. Greed finally returning to the Bitcoin market after all this while could mean that investors are ready to embrace some bullish action once again, which could be a positive sign for the current rally.
BTC Price
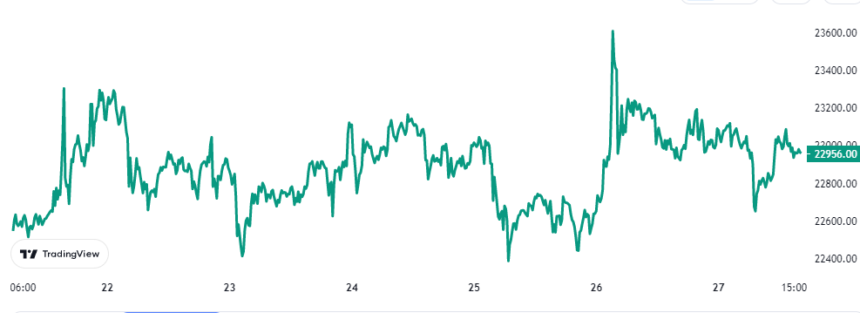
At the time of writing, Bitcoin is trading around $22,900, up 9% in the last week.
The value of the asset seems to have been consolidating in recent days | Source: BTCUSD on TradingView
Featured image from André François McKenzie on Unsplash.com, charts from TradingView.com, Alternative.me


