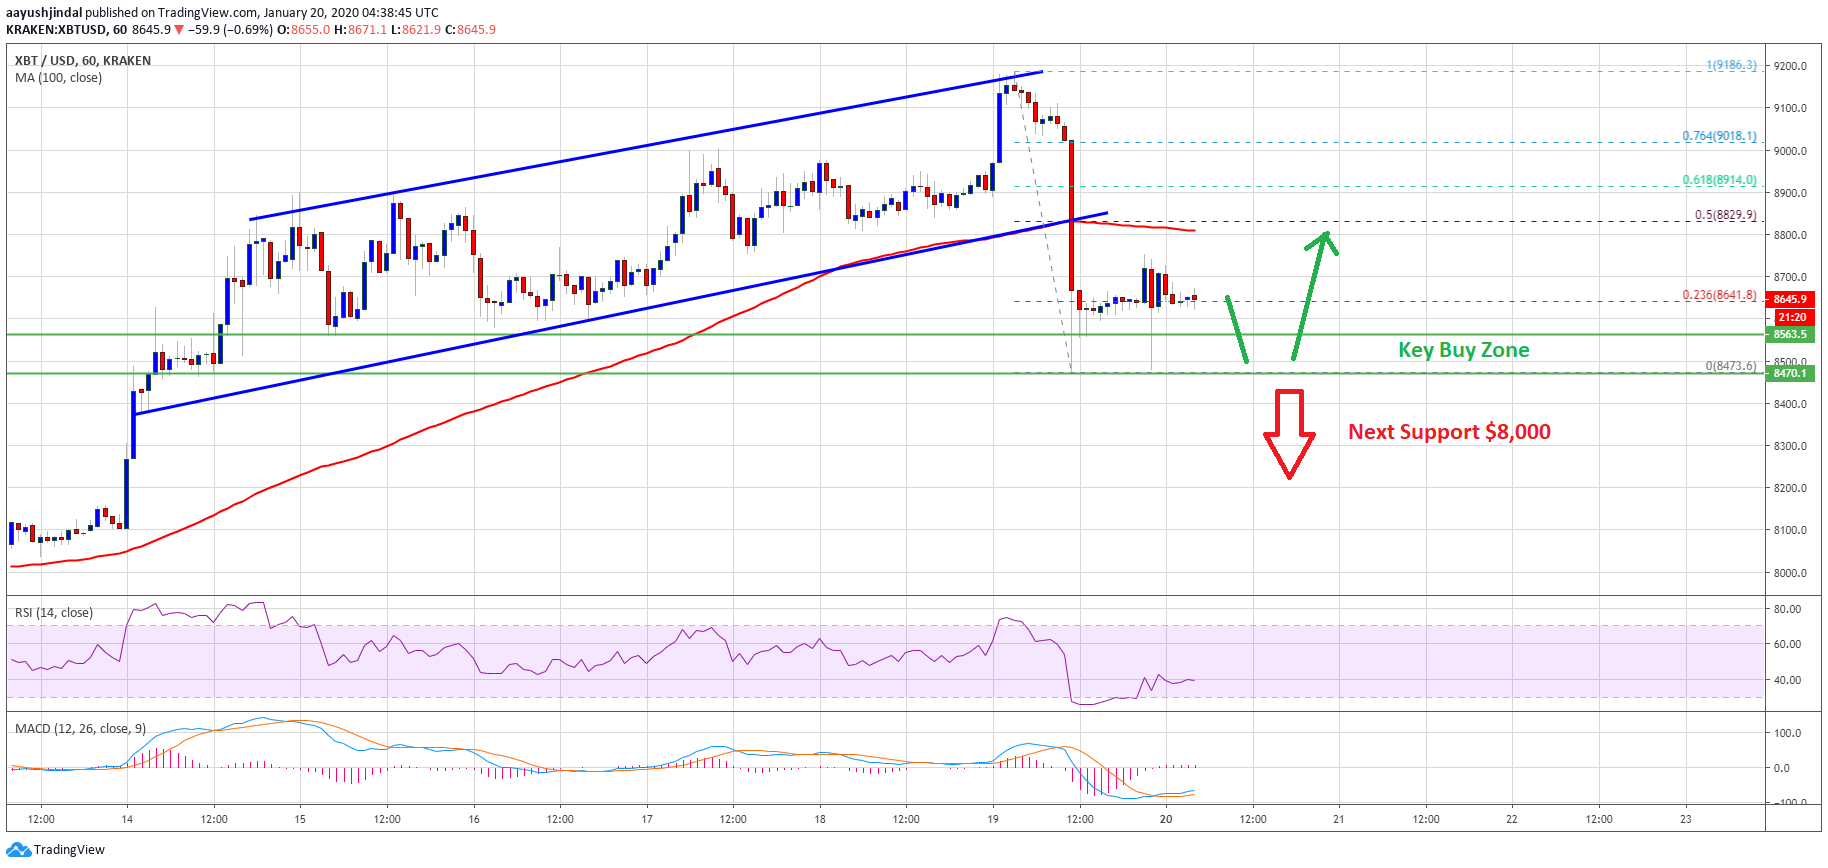
Bitcoin failed to extend gains above $9,200 and started a downside correction against the US Dollar. BTC price tested the $8,500 support and it could bounce back.
- Bitcoin price is down more than 5% from the $9,186 high against the US Dollar.
- The $8,500 support area could play an important role in the coming sessions.
- There was a break below a major ascending channel with support near $8,830 on the hourly chart of the BTC/USD pair (data feed from Kraken).
- The pair could either bounce back from $8,500 or extend its decline towards $8,000.
Bitcoin Holding Key Uptrend Support
Yesterday, we discussed a crucial breakout pattern in bitcoin above $8,500 on the daily chart against the US Dollar. BTC price extended gains above $9,000, but it struggled to clear the main $9,200 and $9,300 resistance levels (as pointed out yesterday).
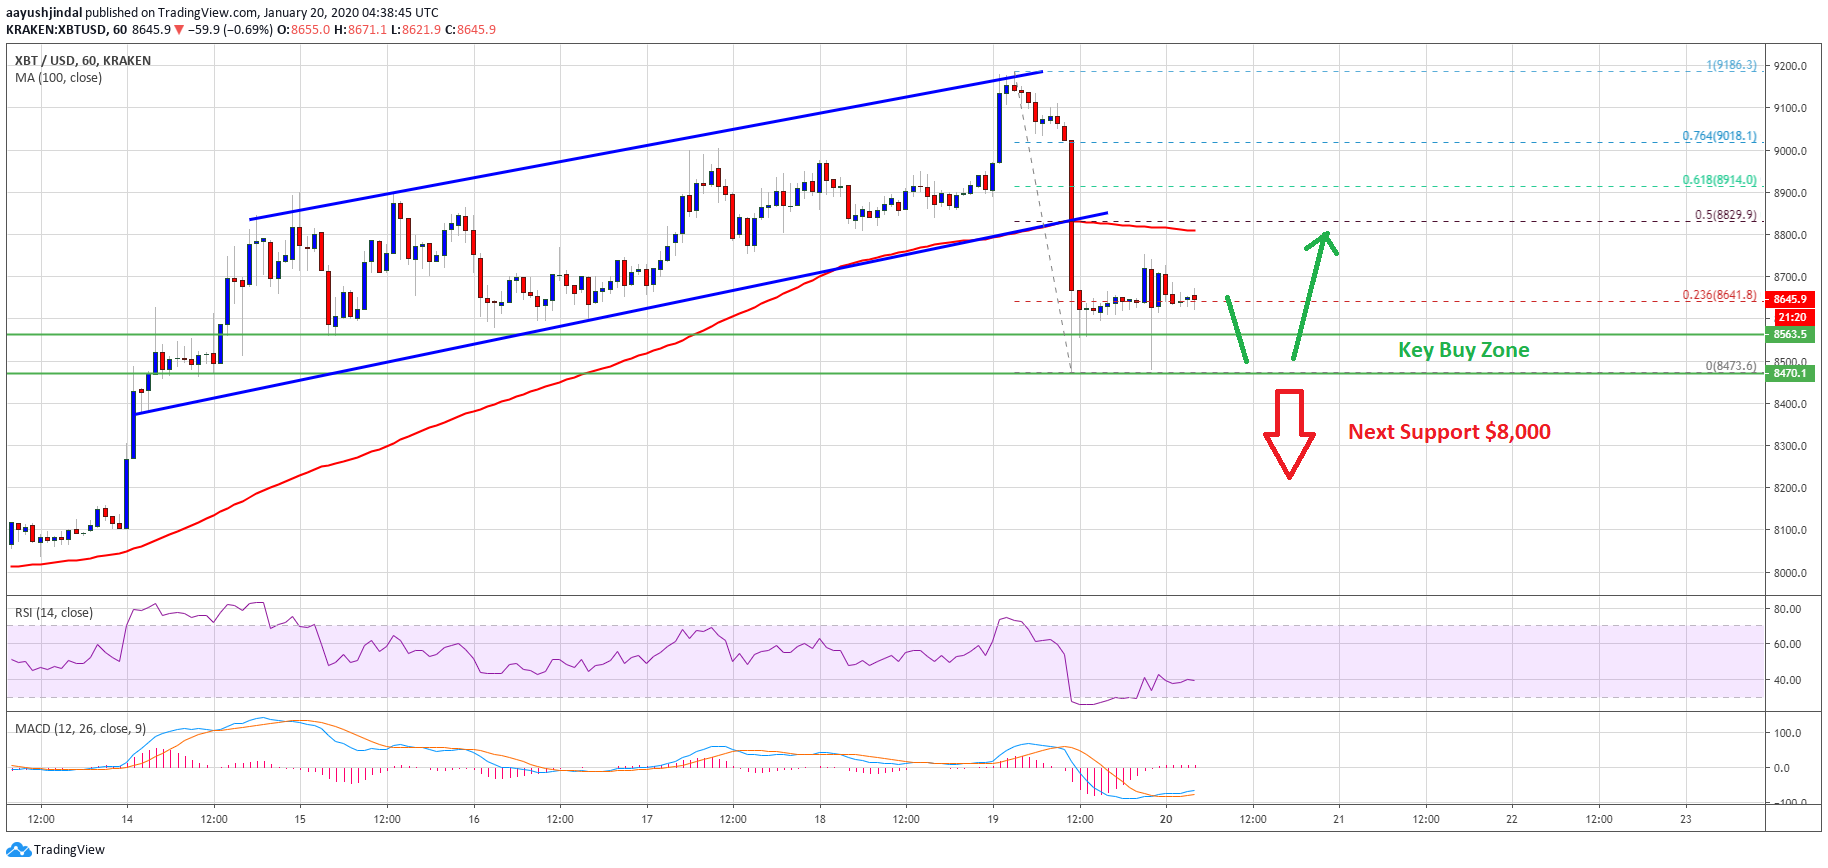
A new 2020 high was formed near $9,186 before the price started a sharp decline. There was a break below the $9,000 and $8,800 support levels. Besides, there was a break below a major ascending channel with support near $8,830 on the hourly chart of the BTC/USD pair.
It opened the doors for more losses below the $8,800 support and the 100 hourly simple moving average. Finally, bitcoin tested the key $8,500 support area, where the bulls took a stand.
A low is formed near $8,473 and the price is currently recovering. It traded above the 23.6% Fib retracement level of the recent slide from the $9,186 high to $8,473 low.
On the downside, the main uptrend support is near the $8,500 level. If there is a downside break below the $8,500 support, the price could extend its correction towards the $8,000 pivot level. Any further losses below $8,000 might start a downtrend in the near term.
BTC Could Bounce From $8,500
If BTC price stays above the $8,500 support, it is likely to start a fresh increase. The first key resistance is near the $8,800 area and the 100 hourly simple moving average.
Additionally, the 50% Fib retracement level of the recent slide from the $9,186 high to $8,473 low is also near the $8,830 level. Therefore, bitcoin must surpass the $8,880 area to resume is uptrend towards $9,200 and $9,500 in the coming days.
Technical indicators:
Hourly MACD – The MACD is losing momentum in the bearish zone and turning bullish.
Hourly RSI (Relative Strength Index) – The RSI for BTC/USD is currently near 40 and struggling to rise towards 50.
Major Support Levels – $8,500 followed by $8,000.
Major Resistance Levels – $8,800, $8,830 and $9,200.


