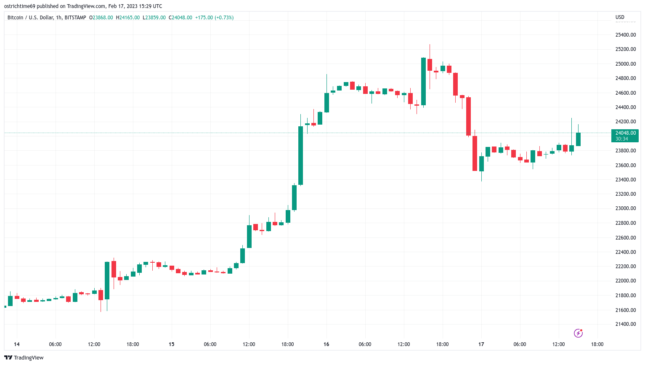
Bitcoin (BTC) climbed back above $24,000 at the Feb. 17 Wall Street open as analysis favored “consolidation and continuation” higher.
Bitcoin faces key level to “break” bear trend
Data from Cointelegraph Markets Pro and TradingView showed BTC/USD recovering some overnight losses after dipping to $23,369 on Bitstamp.
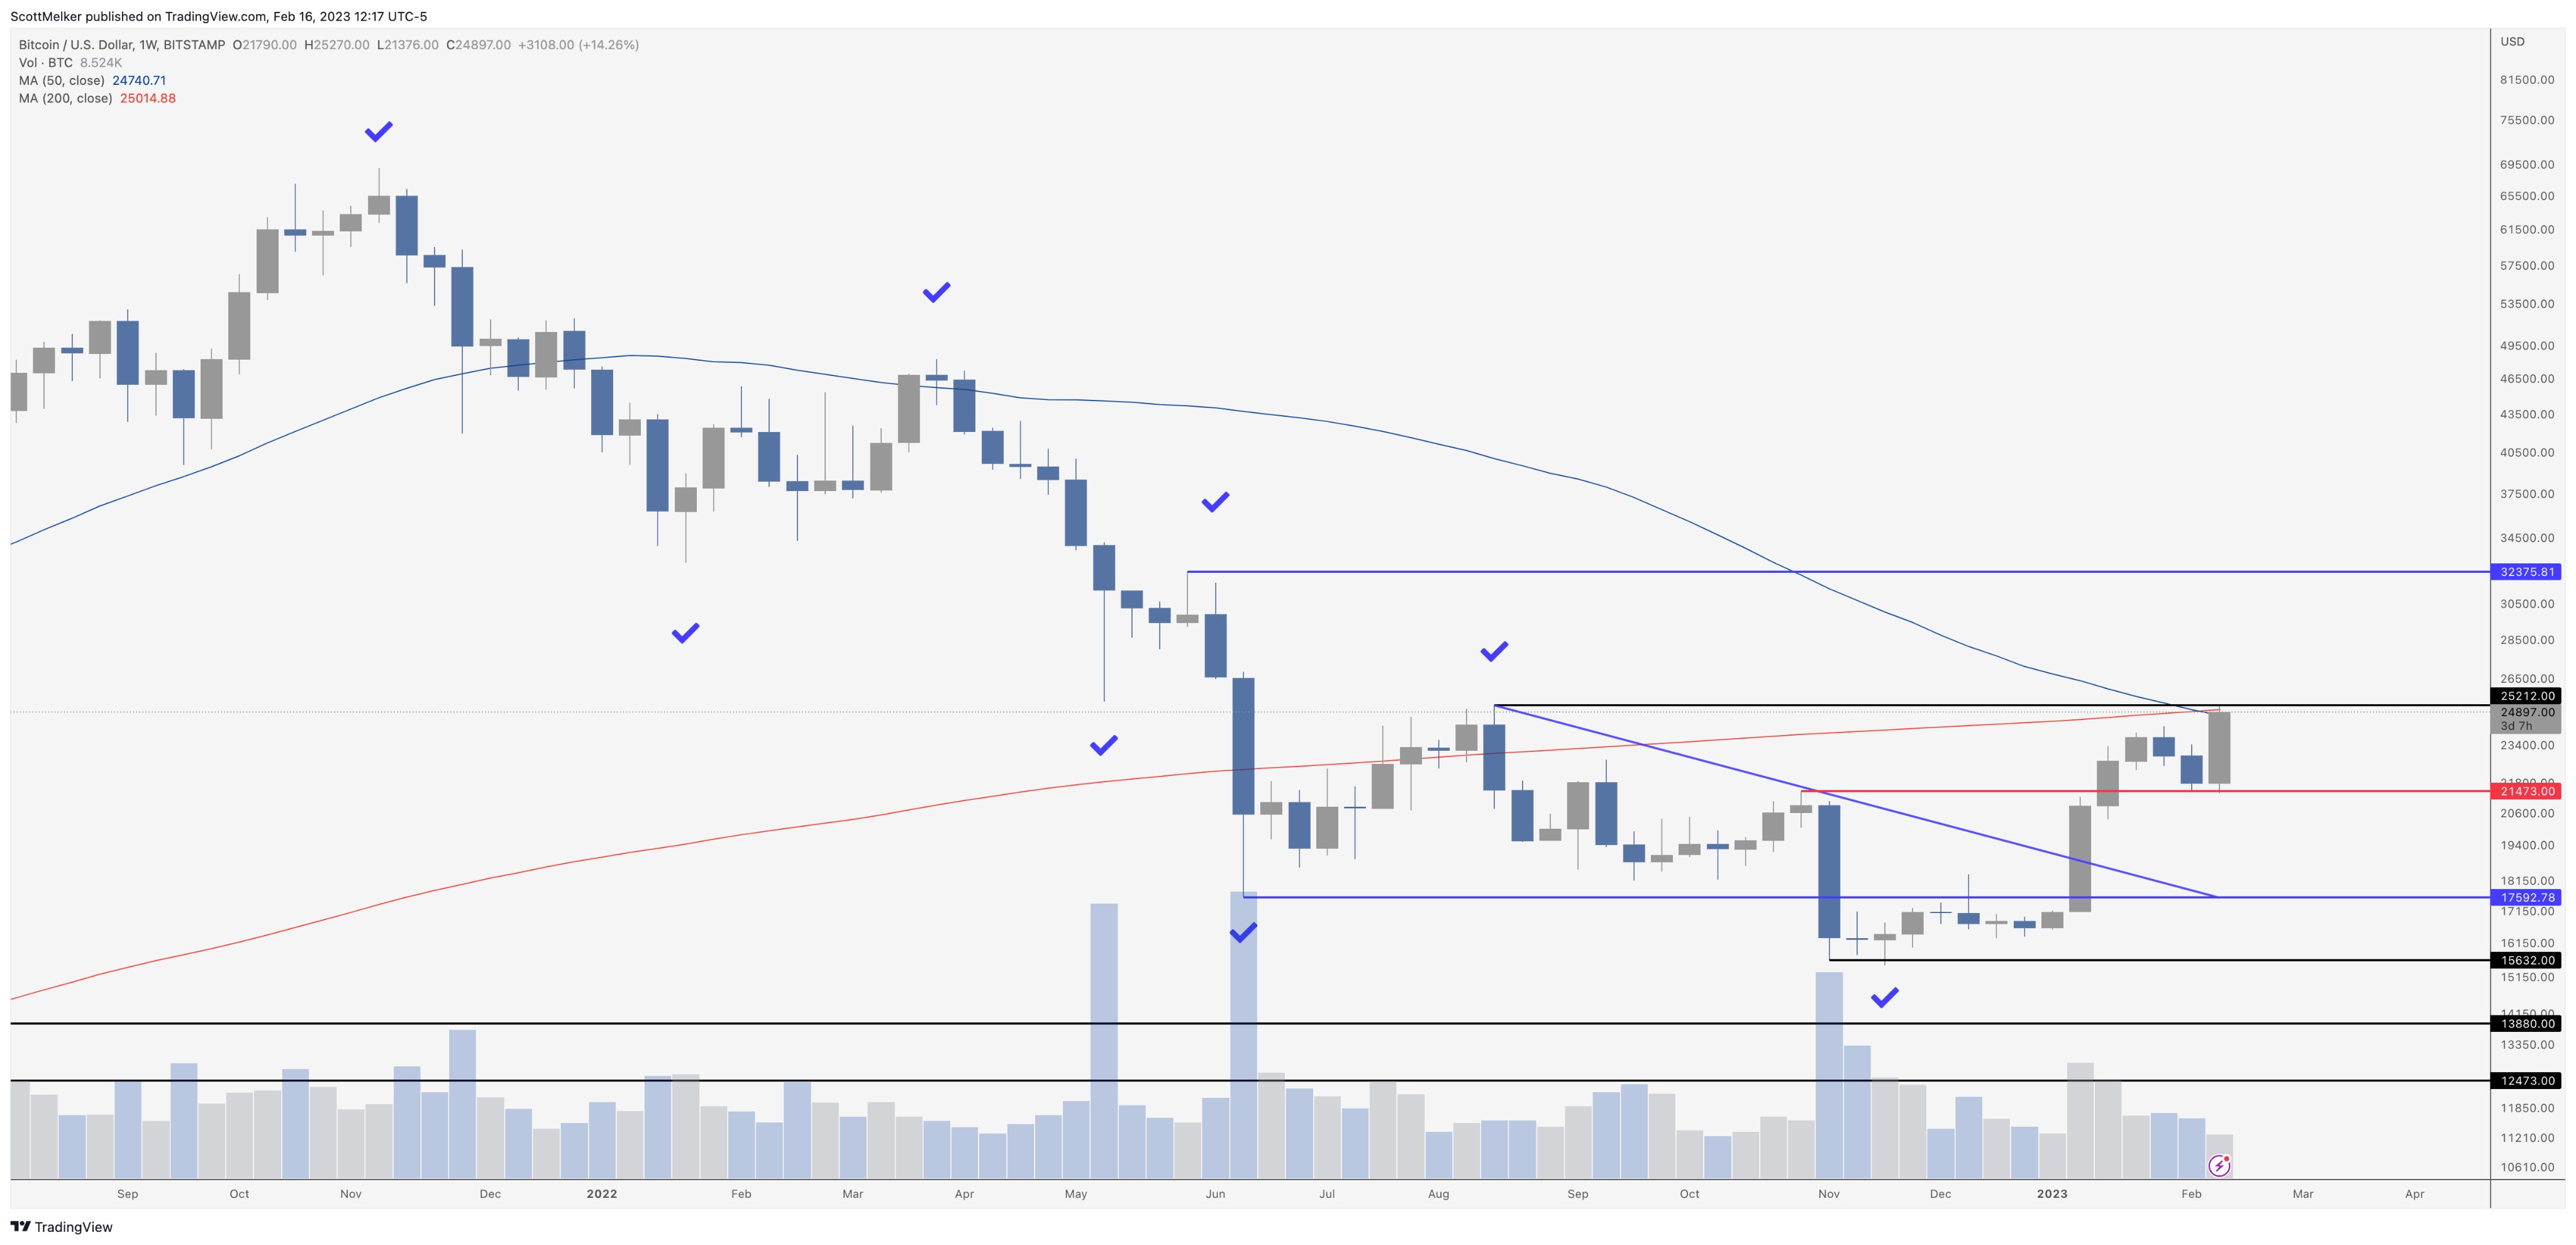
The pair had hit fresh six-month highs the day prior, these facing stiff resistance in the form of two weekly moving averages (MAs) and a heavy sell wall.
Scott Melker, the trader and podcast host known as “The Wolf of All Streets,” stressed the importance of levels acting as lines in the sand for bulls.
“$25,212. I’ve been screaming about this number for weeks. A break above (ideally close) makes a higher high for the first time since $69,000,” he tweeted about the weekly chart on Feb. 16.
“That breaks the bear trend. Just tapped it, to the penny… and dropped in the short term. Time to pay attention!”
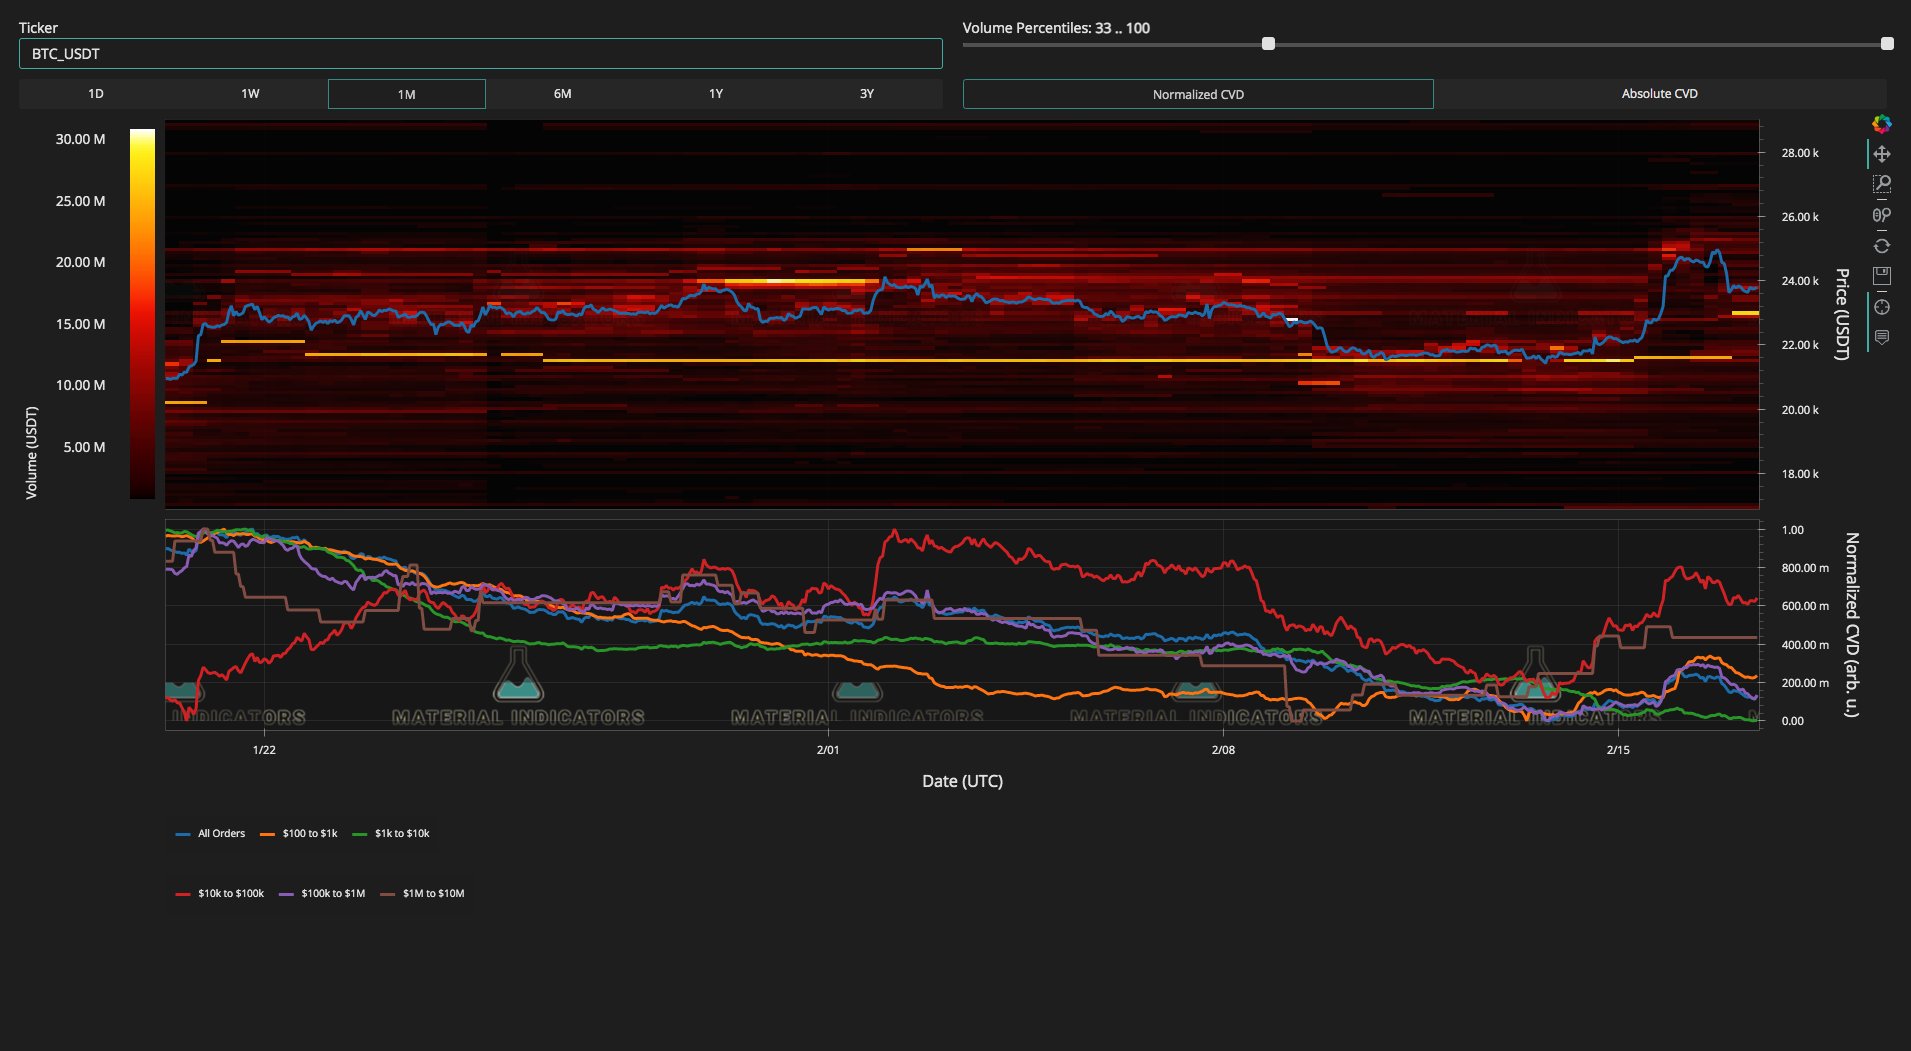
Investigating activity on exchanges, monitoring resource Material Indicators identified bid support inching higher, taking spot price with it.
“The notorious BTC buy wall we’ve been tracking for 5 weeks just strategically moved again, this time just above the 21-Day Moving Average,” it noted alongside a chart.
“This entity seems to be playing the Technicals level by level.”
Accompanying data from the Binance BTC/USD order book also showed resistance laddered up to $25,600 — well above the site of the 200-week MA, which flipped from support to resistance last August.
Trader: Crucial support at $22,800
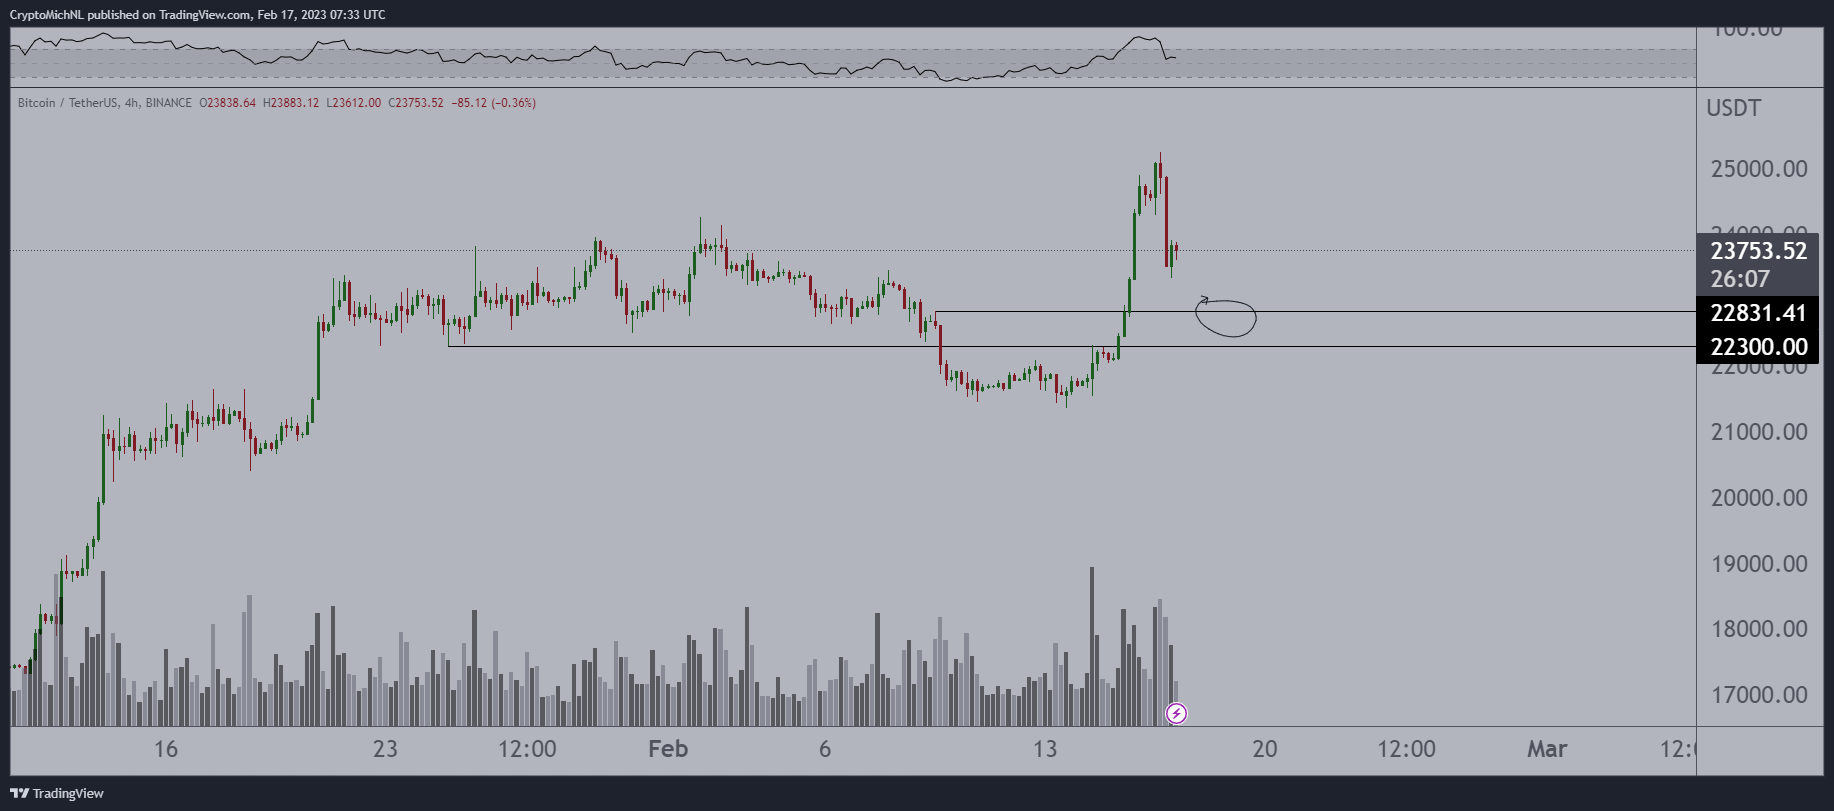
Cointelegraph contributor Michaël van de Poppe was upbeat on the outlook, meanwhile, calling for “consolidation and continuation.”
Related: Bitcoin metric prints ‘mother of all BTC bullish signals’ for 4th time ever
“Bitcoin sees a sweep of the high and rejects a little there, but that doesn’t mean we’ll go to $12K,” he reasoned in a tweet on the day.
A chart flagged $22,800 as the key area for bulls to hold should BTC/USD opt to print a higher low (HL) next.
The day prior, Van de Poppe argued that the period from March to June should be a “party” throughout crypto markets.
“It’s hard to define a proper strategy when everyone around you shouts the opposite. That’s what’s happening in those relief rallies,” he continued about the current state of crypto sentiment.
“People are stuck in the mindset of the past 18 months and can only expect further downside. Hence they keep on shorting.”
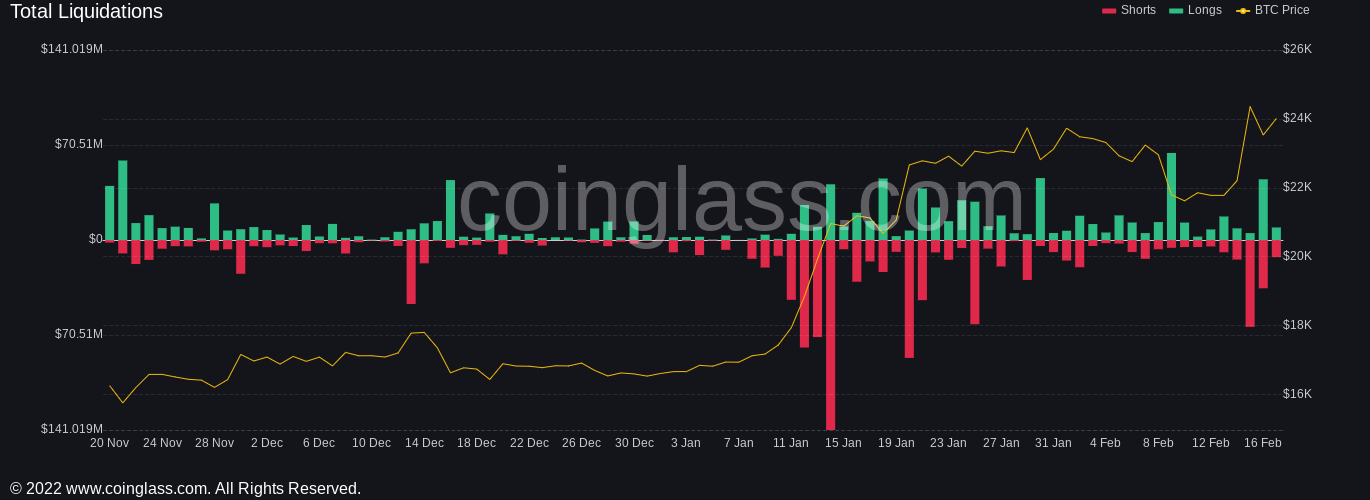
It was long traders who nonetheless felt the bulk of the pain on Feb. 16, as Bitcoin’s trip lower liquidated $45 million of positions, data from Coinglass shows. Cross-crypto long liquidations almost reached $125 million.
The views, thoughts and opinions expressed here are the authors’ alone and do not necessarily reflect or represent the views and opinions of Cointelegraph.
