
Bitcoin’s long-term holder cohort appears to have stopped net selling, according to multiple on-chain commentators, in a shift that could remove a key source of structural supply pressure heading into 2026.
The change hinges on a supply-change read of long-term holders (coins held longer than six months), which had been negative for months but has now turned modestly positive, said on-chain analyst Darkfost.
Is This The Bitcoin Bottom Signal?
Darkfost argues that recent claims about long-term holders “selling more than ever” miss what the data is actually showing, especially when large, discrete exchange-related movements skew the picture. “On this chart, which I adjusted to isolate the movement of nearly 800,000 BTC from Coinbase that was distorting LTH data, we can observe a clear shift in supply change,” Darkfost wrote. “Since July 16, the monthly LTH supply change (30 day sum) had been firmly anchored in a distribution phase until recently.”
Related Reading
In plain terms, that meant the share of supply held by long-term holders had been declining for much of the second half of 2025, a regime that tends to coincide with persistent sell pressure as older coins rotate into the market. That phase, Darkfost said, has now ended, at least for the moment.
“We have now moved back into positive territory, with around 10,700 BTC transitioning into long term held coins,” Darkfost wrote, calling it “a very modest change,” but “not insignificant.” The implication is that long-term holders have eased off distribution enough for their aggregate holdings to start rising again, even as short-term holders “continue to hold their BTC,” in Darkfost’s framing.
CryptoQuant CEO Ki Young Ju echoed the directional takeaway in a shorter post, saying, “Bitcoin long-term holders stopped selling.”
Related Reading
VanEck’s head of digital research Matthew Sigel characterized the turn as a meaningful shift in positioning pressure via X. “BTC: Long-term holders turn net accumulators, easing a major Bitcoin headwind and ending, for now, the largest sell pressure event from this cohort since 2019,” Sigel wrote.
Renowned expert James Van Straten added historical context to the scale of the move, saying the magnitude of distribution “marked the 2019 bottom as well,” suggesting the current inflection is notable even if it doesn’t, by itself, guarantee a repeat.
Darkfost also pointed to historical patterning around these flips. “Historically, such shifts have often preceded the formation of consolidation phases or even bullish recoveries, depending on how the broader trend evolves,” he wrote, emphasizing conditions rather than certainty.
At press time, BTC traded at $88,623.
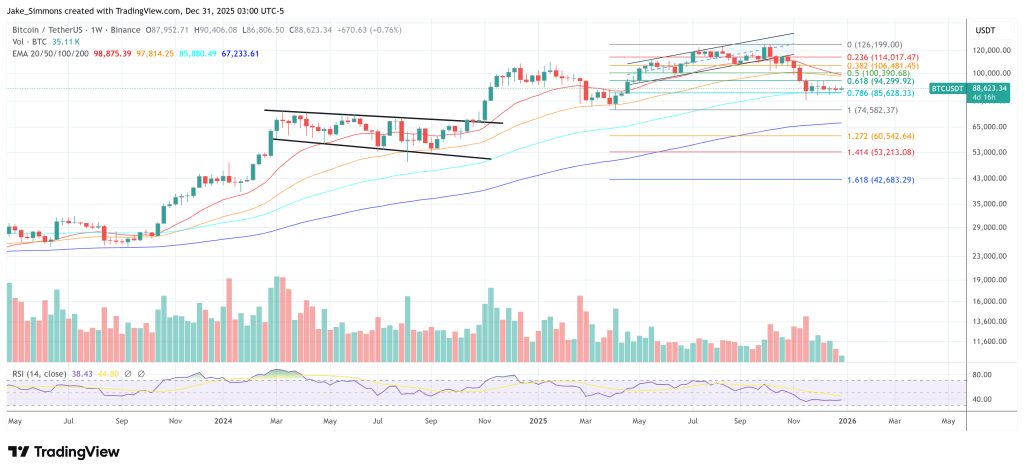
Featured image created with DALL.E, chart from TradingView.com


