In a breakdown of Bitcoin’s current market dynamics, prominent crypto analyst Dan Gambardello, in his latest video titled “Bitcoin Must Do This Now,” addressed his 368,000 followers on YouTube regarding the critical resistance levels Bitcoin is currently testing. Gambardello emphasized the importance of these levels for both short-term price movements and broader market indicators.
Why Bitcoin Must Turn Bullish Now
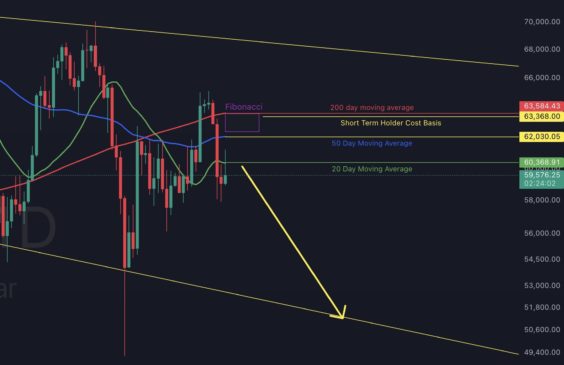
Gambardello’s analysis begins with an emphasis on the significance of the short-term holder cost basis, which currently stands at $63,600. He highlighted this metric as a pivotal momentum indicator, underscoring its role in determining the immediate bearish or bullish nature of the market. “Bitcoin is just $2,000 away from the short-term holder cost basis now at $63,600.” According to Gambardello, this is a critical momentum indicator investors need to watch.
Gambardello also maps out the various resistance zones that Bitcoin needs to conquer to signal an optimistic market turnaround. He points out that Bitcoin is operating just above the 20-day moving average on the daily chart at the time of his analysis. However, the proximity of the closing time for the daily candle left the situation highly tentative. The 50-day and 200-day moving averages were also discussed as significant barriers that needed to be breached to confirm a bullish trend.
Related Reading
In addition to these moving averages, the Fibonacci retracement levels form another cornerstone of his technical scrutiny. He elaborates on the potential for Bitcoin to encounter a lower high resistance area, which could lead to either a price consolidation or a downward correction if these levels failed to be surpassed.
Gambardello also ventures into macroeconomic territory. He indicates that the prevalence of recession-related fears could hint at broader economic shifts that might impact the broader crypto market. “The algorithms on X are bombarding me with recession posts, recession data, recession charts. There’s a probable increase because there are actually a lot of indicators that the market is going to crash,” he explained.
Moreover, the crypto analyst is heavily focusing on the 20-week moving average, a level he describes as a historically significant marker in distinguishing between bull and bear markets. The failure to sustain levels above this moving average, he points out, often precedes bearish trends, while support at or above this line could herald bullish conditions. “Failing to get above the 20-week moving average is what Bitcoin does when it’s entering bear markets,” he observes.
Related Reading
From a momentum perspective, the analyst drew attention to the Relative Strength Index (RSI) and Moving Average Convergence Divergence (MACD) indicators. Both tools, he mentions, currently suggest that Bitcoin is well-positioned for potential upward movement, given the consolidation patterns and cooling periods observed recently.
However, Bitcoin must move upwards now. “Bitcoin really took off last cycle when the RSI was around 54 […] if you go back two cycles, Bitcoin was consistently around 53, 50 close to 54 before taking off each time […] consolidation in the RSI, then boom. So we’re from a momentum perspective right where it needs to be. But the move that we need is up now,” the crypto analyst warns.
Another warning sign could be a lasting fall below the 20-week moving average. “We need to see Bitcoin above that 20 week moving average. […] If we see resistance […] we have to anticipate that we could go in the lower $50,000s very fast. It could happen very fast,” Gambardello says, marking it as an essential condition for the commencement of a sustained bullish phase.
From a bullish perspective, Gambardello is waiting for a breakout above $63,700. “We’re looking for bullish confirmations to break this entire range and really currently it’s like $63,000 or up to around 63,700 – that’s the range, it’s not even a big range for Bitcoin to make the move but that’s what we’re watching,” he remarks.
Overall, it’s a question of $50,000 or $70,000 as Gambardello puts it on X: “A break above could trigger a mini run towards $70k. Failure could mean new lows around $50k.”
At press time, BTC traded at $
Featured image created with DALL.E, chart from TradingView.com


