
October has traditionally been a pivotal moment for Bitcoin’s price action. Historical data shows an enticing average price increase of 17% for the month (excluding the early, volatile years of Bitcoin). In pre-halving years, this average price fluctuation is slightly higher, around 21%.
If the same price change occurs in 2023, Bitcoin could reach somewhere between $32,000 and $33,000 in October. But will this month follow the historical trend, or is a bearish turn still possible?
October Over Time
October has been particularly bullish for Bitcoin, with an average of 17% of price increases over the years. Since 2023 is a pre-halving year, comparisons with other pre-halving years are particularly insightful. In the pre-halving years of 2019 and 2015, the average price increase was 20%.
Bitcoin monthly returns over the years. Source: intothecryptoverse
In 13 years of Bitcoin price action, 9 have seen increases during October. This makes another bullish October seem quite likely.
Interestingly, September, known for its bearish tendencies, has broken its pattern this year, with Bitcoin’s price seeing a 5% increase. This is the first instance of such a deviation in over 7 years. This anomaly prompts the question: could October’s price action also diverge from the historical pattern?
Bitcoin Price Action In Pre-halving Years
Another important caveat to consider is that during pre-halving years, Bitcoin’s price tends to exhibit a predictable pattern where there are 5-6 months when the price decreases. However, 2023 has been an outlier so far, with only three red months observed currently:
In the pre-halving years, we get 5-6 red months (usually 6)
In 2023, we’ve only had 3 so far.
Three months are remaining till the end of the year.
So based on probability, we could get three more red months or at the very least, two. pic.twitter.com/lYpykuxO0m
— Predycto (@predycto) October 1, 2023
This unexpected deviation could prompt a re-evaluation of what the remaining months of 2023 may hold for Bitcoin. To see the usual six months of price decreases, every month remaining in the calendar year would need to show a reduction.
Bitcoin In 2019:
Examining Bitcoin’s price movements in Q4 of 2019 can offer a comparative perspective.
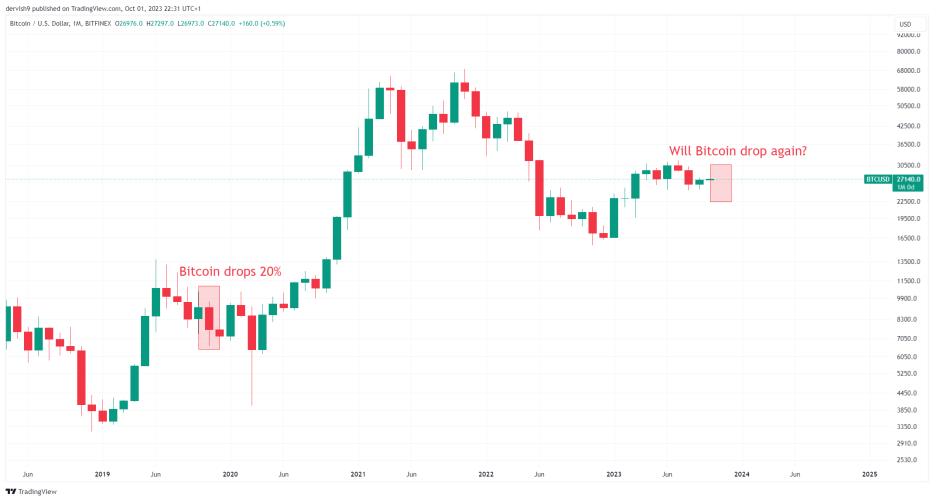
Bitcoin's 2023 price comparison with 2019 . Source: BTCUSD on TradingView
Q4 2019 showed significant retracements in Bitcoin’s price, as it decreased by 20% from the beginning of October until the end of the year. If we witness similar price movements this year, it will lead to Bitcoin reaching below $22,000, presenting potential opportunities and risks for investors.
A Broader Impact
Bitcoin’s price movements serve as an indicator of the broader cryptocurrency market. A bearish trend in Bitcoin could potentially lead to a market-wide downturn, causing an even bigger downturn for Altcoins and coins with low market capitalization.
Conclusion
While October is usually bullish, the anomalies witnessed in 2023 should lead to a more cautious approach to expectations during October. The absence of a bearish September provokes questions about the likelihood of experiencing a bullish October. While history provides guidance, it’s essential to remember it doesn’t dictate the future, and varying factors can alter market behaviors significantly.
Investment Disclaimer: The content provided in this article is for informational and educational purposes only. It should not be considered investment advice. Please consult a financial advisor before making any investment decisions. Trading and investing involve substantial financial risk. Past performance is not indicative of future results. No content on this site is a recommendation or solicitation to buy or sell securities or cryptocurrencies.
Featured image from ShutterStock, Charts from TradingView.com


