In this episode of NewsBTC’s daily technical analysis videos, we are looking at the Bitcoin price bounce today after a steep selloff following the release of CPI numbers for September.
Take a look at the video below:
VIDEO: Bitcoin Price Analysis (BTCUSD): October 13, 2022
At 8:30AM ET this morning, updated Consumer Price Index figures were released to the public, prompting a sharp to-the-minute selloff in Bitcoin and the stock market. Within a couple of hours later, all intraday losses were recaptured in a swift move.
Consumer prices rose 0.4% in September and were up 8.2% year over year. The fact inflation isn’t waning could prompt the Fed to further raise interest rates in November in December. Recent rate hikes are showing very little impact in curbing inflation.
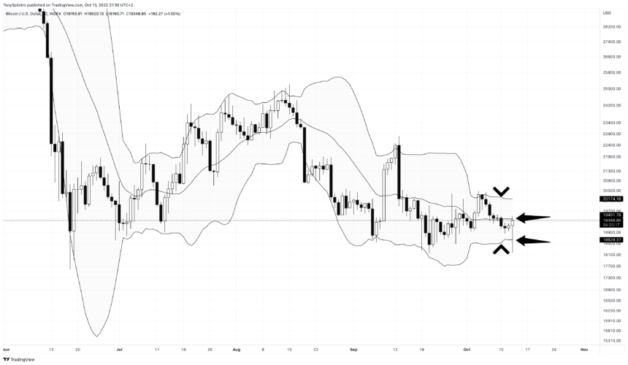
Bitcoin Price Bounces Back From Lower Bollinger Band
Today’s move in Bitcoin price tapped the lower Bollinger Band, but was quickly bought up after traveling outside it. Had BTCUSD been ready to break down, touching the lower would have been the time. Instead, price action snapped back and is brushing up against the middle-BB.
With the Bollinger Bands squeezing, volatility should be released soon enough and after today’s defense, the probability of a move up just increased significantly. Today’s daily close making it above the middle-Bollinger Band would further improve the chances for upside.
The Bollinger Bands appear ready to release volatility | Source: BTCUSD on TradingView.com
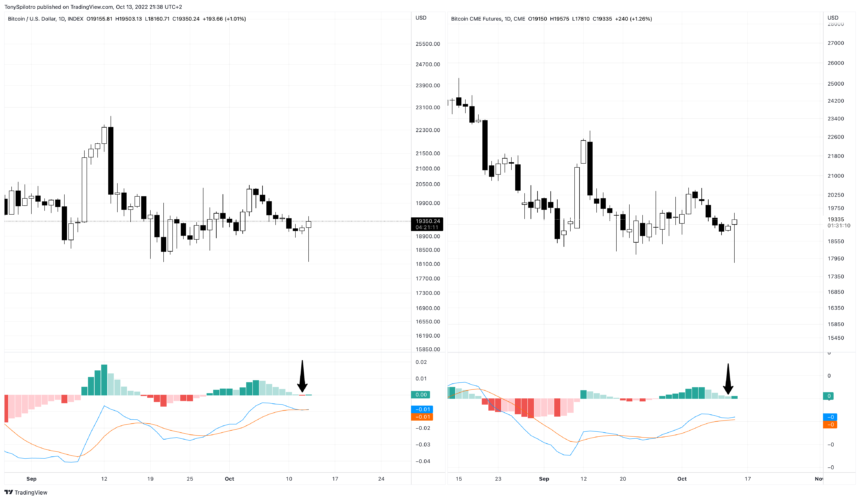
BTC Futures Escapes Bear Cross, Bulls Take Charge
On daily timeframes, the LMACD has crossed bearish on the BTCUSD spot index and other spot exchanges. Meanwhile, CME BTC price charts are still bullish and showing signs of diverging up.
Discrepancies in the LMACD between the spot index and CME Bitcoin futures in the past have been notable. During the 2021 second peak at $68K, spot Bitcoin exchanges had crossed bullish, while CME traders narrowly avoided the bull cross. The discrepancy happened at the exact top of the bull run.
On the way down, ahead of the LUNA collapse, there was another discrepancy between spot exchange and CME futures using the LMACD. Spot once again flipped bullish, while CME stayed bearish the entire time.
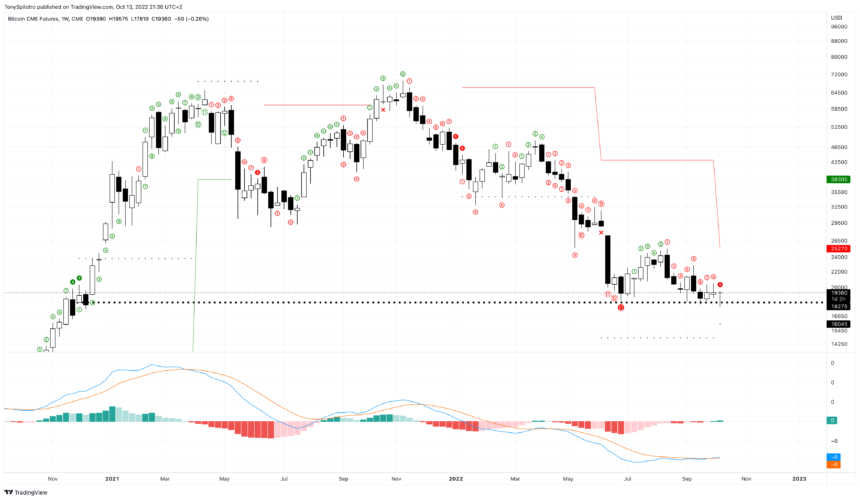
TD9 Buy Signal Gets Perfected With Sweep Of Lows
One thing is for certain: the weekly LMACD on both spot and CME are exactly the same. However, price action is not. CME was closed when we had a wick down to $17,500. This means that today’s low swept all previous lows.
Because lows were swept on CME Bitcoin futures, it was enough movement to trigger a perfected TD9 buy setup on weekly timeframes. The perfected TD9 buy setup happened at a former failed TD9 sell signal, and a cluster of support that coincides with Bitcoin’s former all-time high. If Bitcoin can stage a recovery here, the level might hold permanently.


