
Bitcoin (BTC) shrugged off gains at the March 13 Wall Street open as US inflation markers continued to fall.
BTC/USD 1-hour chart. Source: Cointelegraph/TradingView
Good news is bad news? Bitcoin follows stocks lower
Data from Cointelegraph Markets Pro and TradingView showed BTC/USD circling $81,500, down 2.3% on the day.
The February print of the Producer Price Index (PPI) came in below median expectations, copying the Consumer Price Index (CPI) results from the day prior.
“On an unadjusted basis, the index for final demand advanced 3.2 percent for the 12 months ended in February,” an accompanying press release from the US Bureau of Labor Statistics (BLS) stated.
“In February, a 0.3-percent increase in prices for final demand goods offset a 0.2-percent decline in the index for final demand services.”
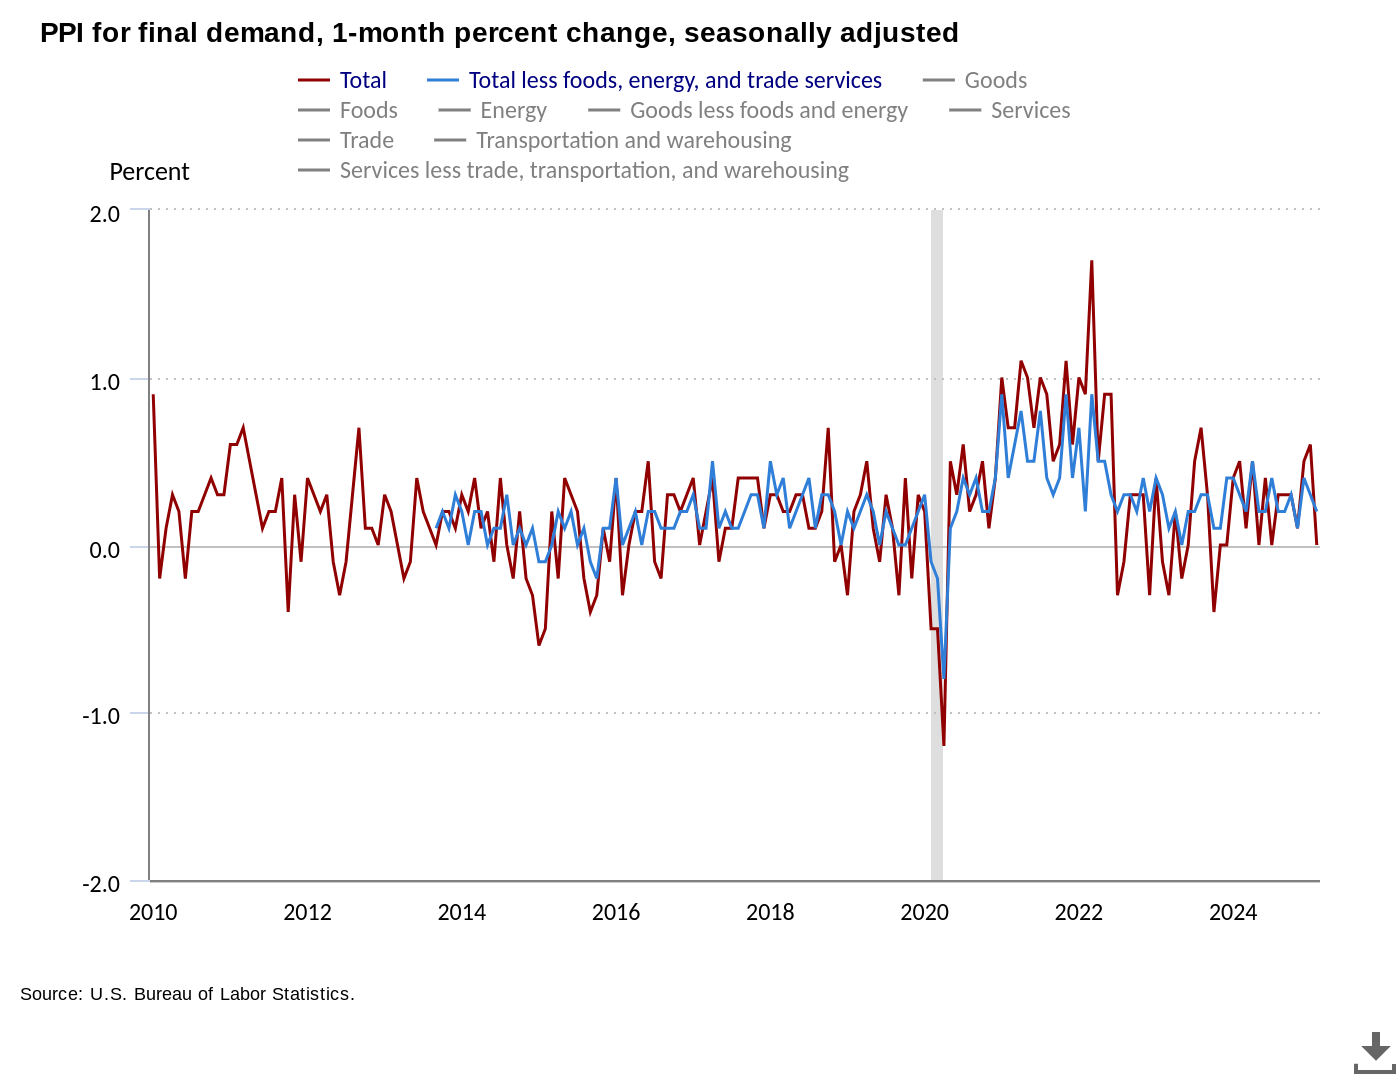
US PPI 1-month % change. Source: BLS
Already a double tailwind for crypto and risk assets, cooling inflation also stunted a rebound in US dollar strength, as viewed through the US Dollar Index (DXY).
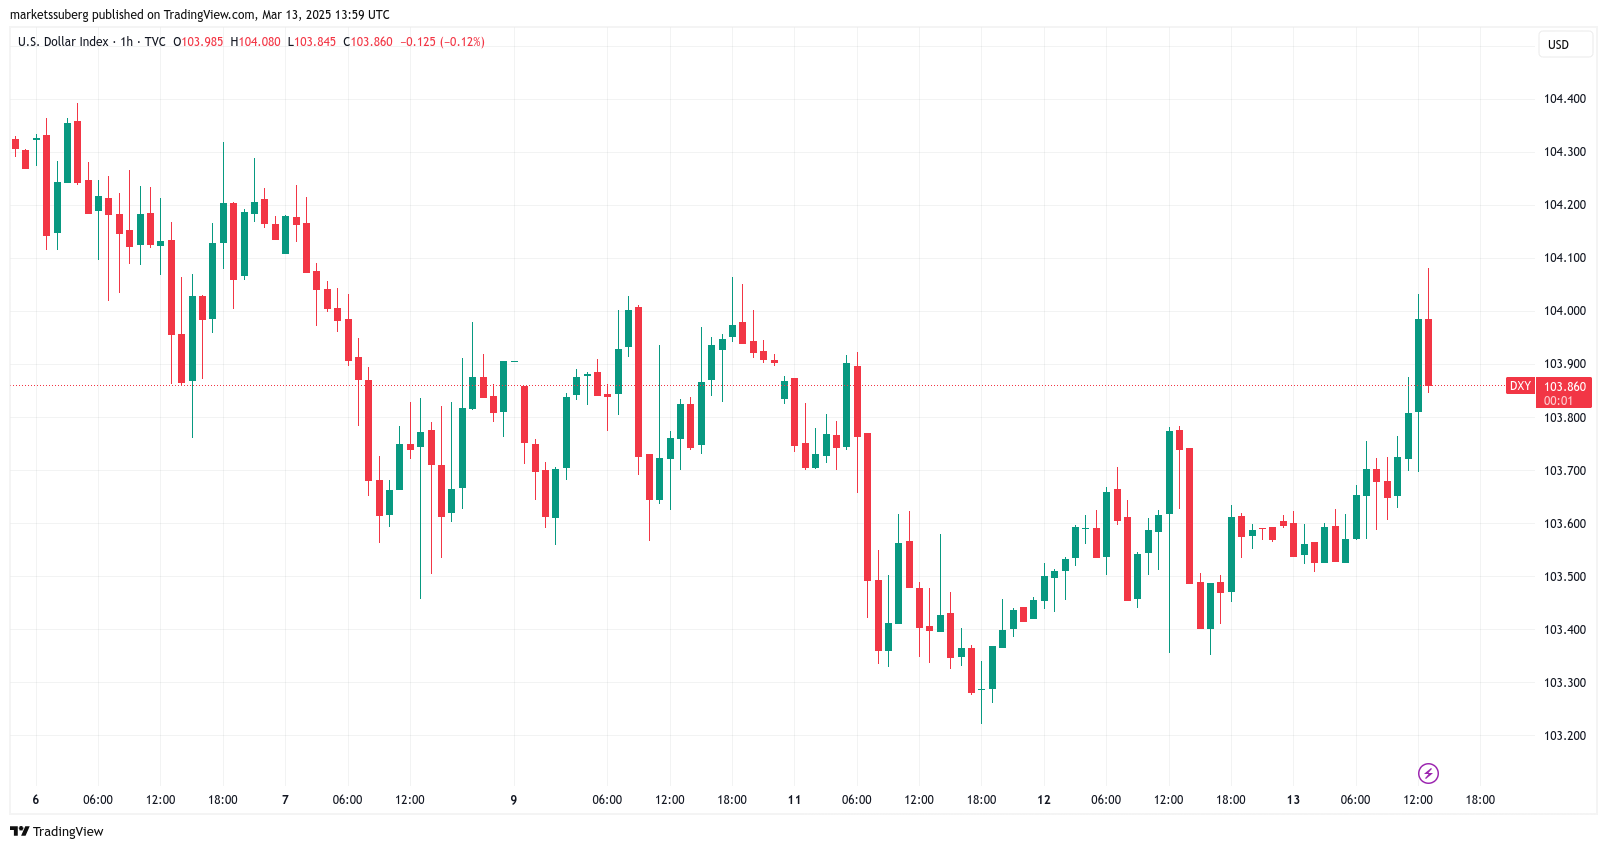
US Dollar Index (DXY) 1-hour chart. Source: Cointelegraph/TradingView
Despite this, both stocks and crypto remained unmoved, leading trading resource The Kobeissi Letter to tie in the ongoing US trade war.
“As we have seen, the market has had a very MUTED reaction to inflation data that would’ve previously sent the S&P 500 SHARPLY higher,” it wrote in part of its latest analysis on X
“Why is this the case? This data provides President Trump a reason to keep doing what he is currently doing.”
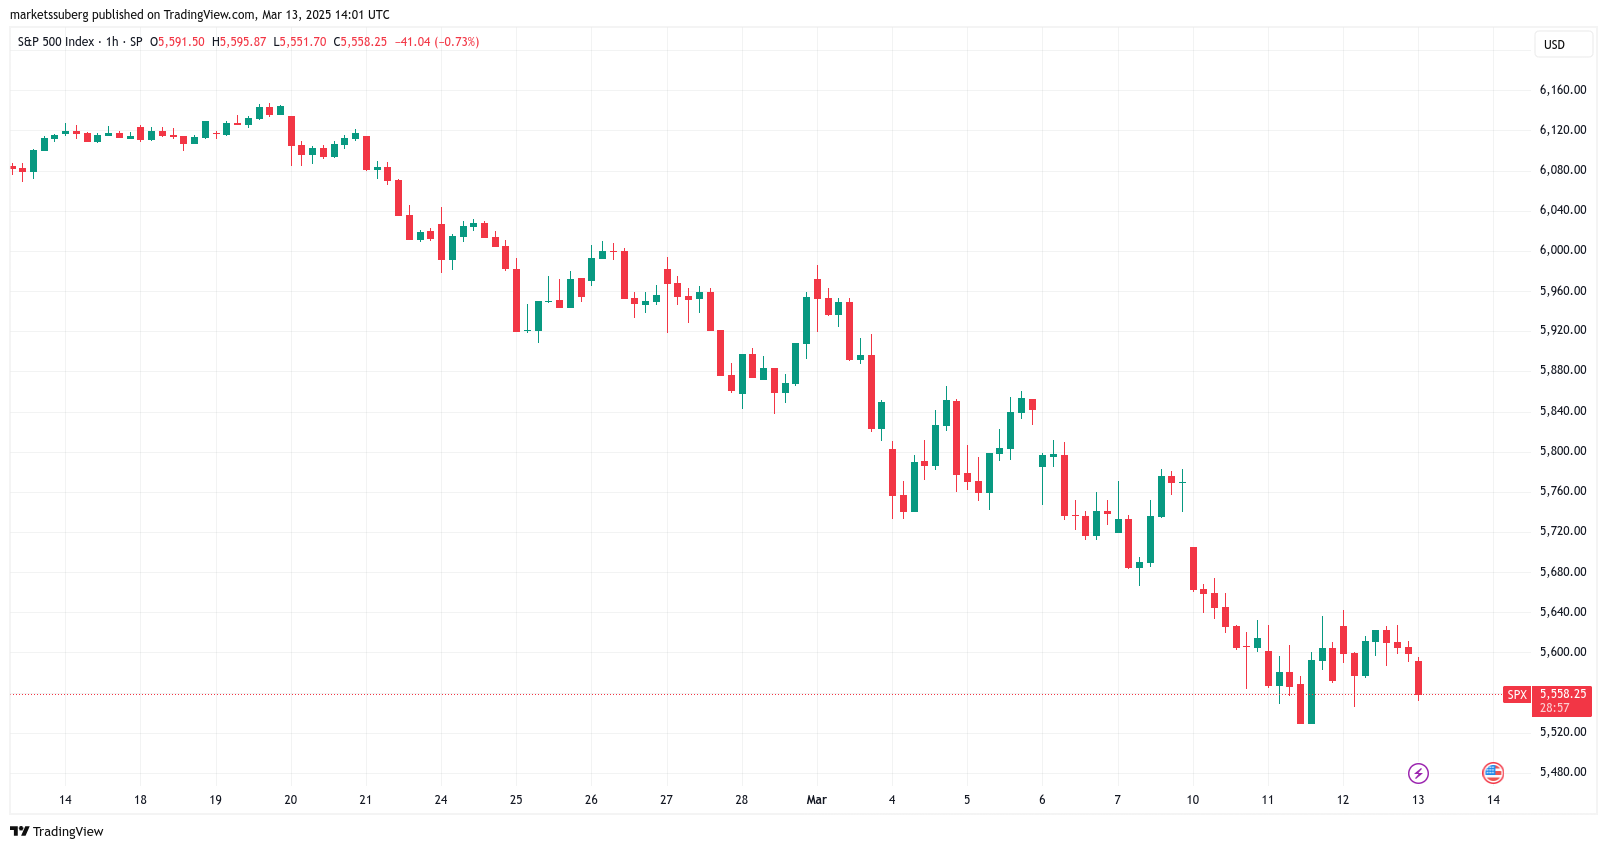
S&P 500 1-hour chart. Source: Cointelegraph/TradingView
Kobeissi explained that trader war efforts may now intensify given slowing inflation.
“This is exactly why markets are not recovering losses following some of the best inflation data in months,” it continued, suggesting traders should “buckle up for more volatility.”
A week before the Federal Reserve’s next interest rate decision, market expectations for financial easing remained similarly lackluster, with the chance of a cut at just 1%, per data from CME Group’s FedWatch Tool. Odds for the Fed’s May meeting were at 28%.
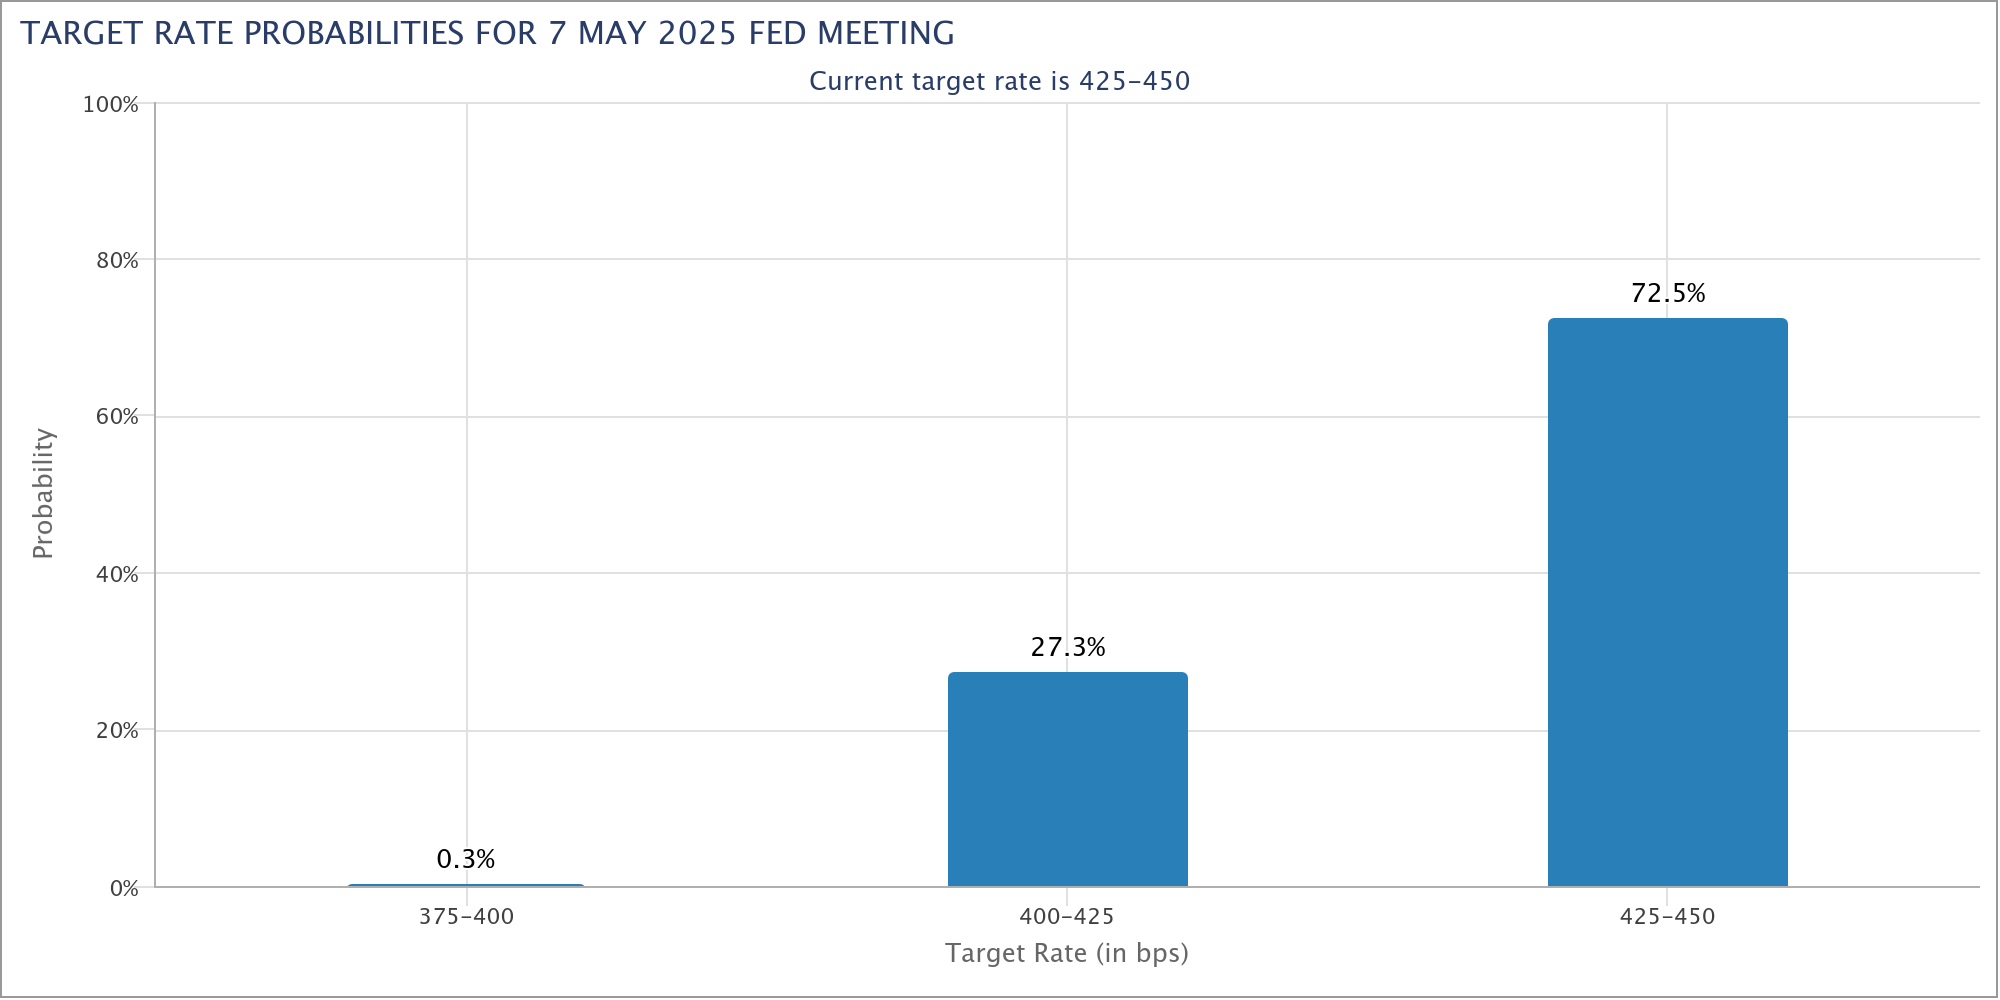
Fed target rate probabilities. Source: CME Group
“The Fed has already decided: steady course, no cuts this FOMC. Powell made that clear last week,” popular crypto trader Josh Rager told X followers earlier in the week, referencing a recent speech by Fed Chair Jerome Powell.
“Rate cuts? More likely in May/June, not March.”
BTC price inertia leaves key resistance intact
Bitcoin price action thus sat between bands of buy and sell liquidity on exchange order books, with the 200-day simple moving average (SMA) in place as resistance.
Related: Bitcoin whales hint at $80K ‘market rebound’ as Binance inflows cool
For Keith Alan, co-founder of trading resource Material Indicators, this trendline, which typically functions as support during Bitcoin bull markets, was the nearest important level to reclaim.
“Bitcoin faces strong resistance at the 200-Day MA for the 4th consecutive day,” he summarized on X.
Referring to Material Indicators’ proprietary trading tools, Alan concluded that such a reclaim was unlikely on the day, notwithstanding surprise catalysts in the form of announcements from the US government.
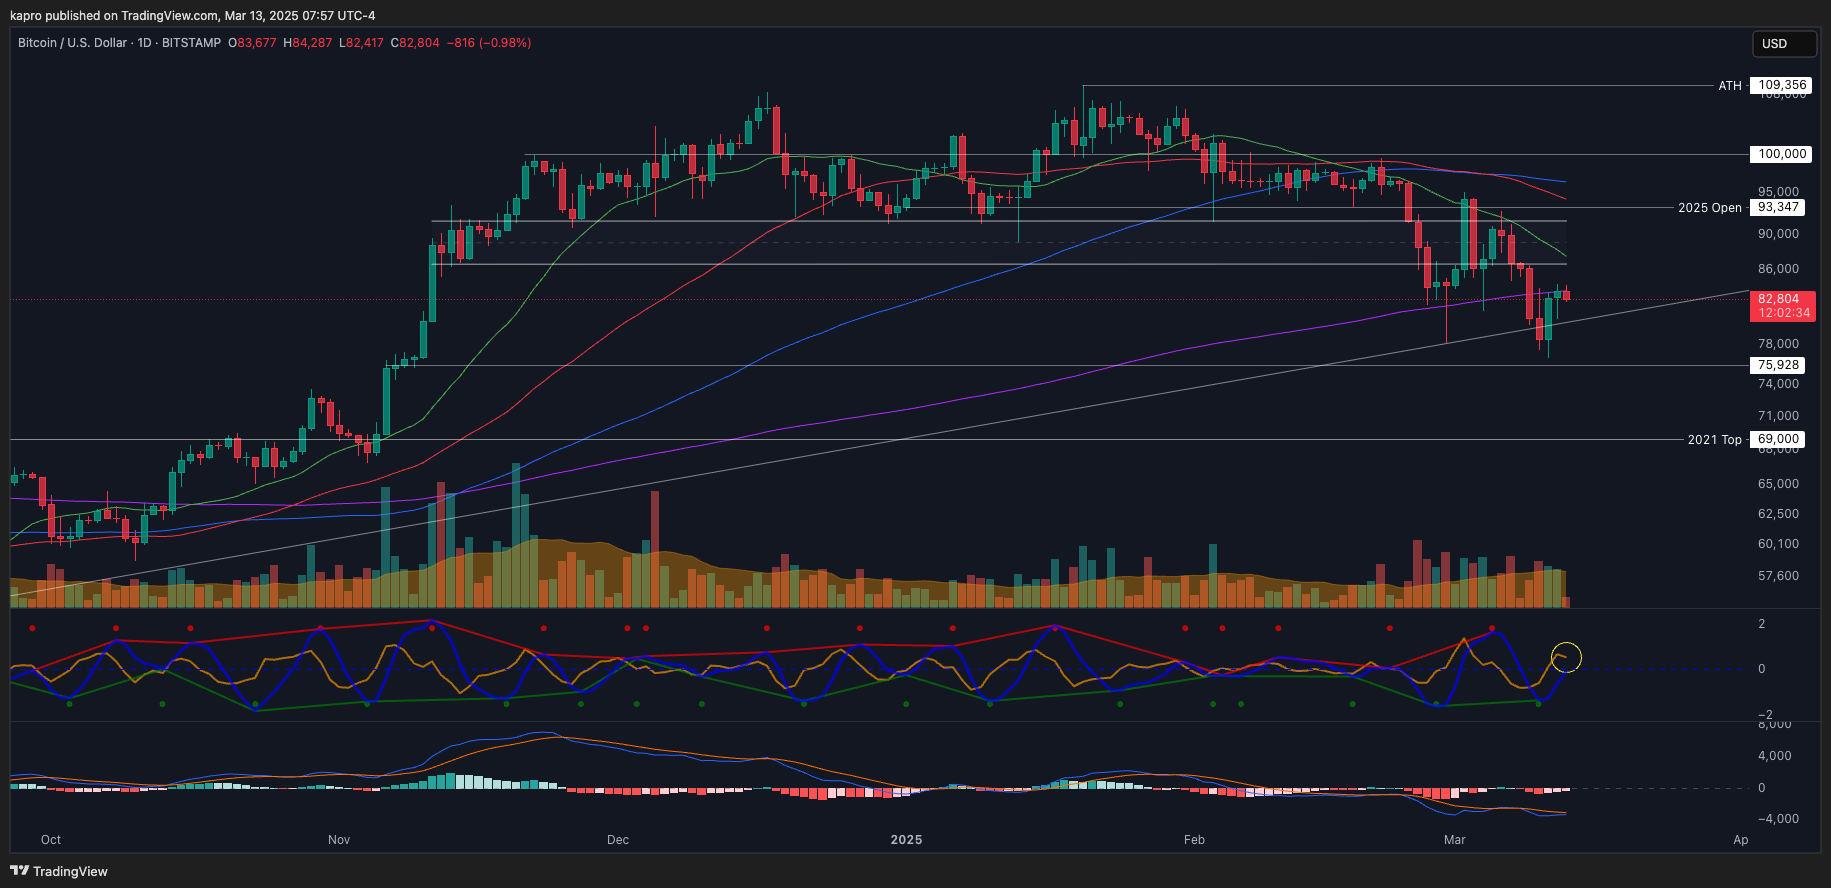
BTC/USD 1-day chart. Source: Keith Alan/X
Meanwhile, data from monitoring resource CoinGlass showed key upside resistance clustered immediately below $85,000.
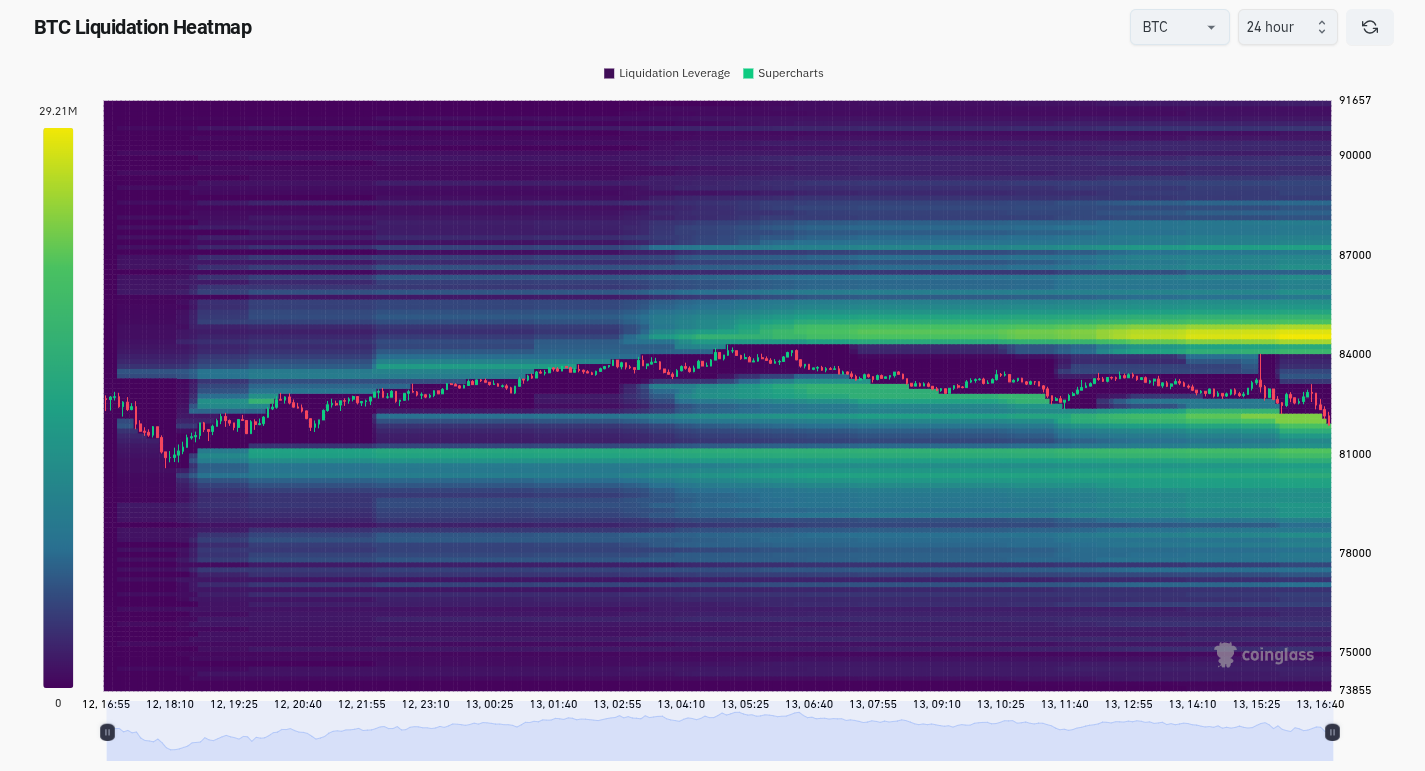
BTC liquidation heatmap (screenshot). Source: CoinGlass
This article does not contain investment advice or recommendations. Every investment and trading move involves risk, and readers should conduct their own research when making a decision.


