
Bitcoin (BTC) sought a local bottom on March 28 while US inflation data came in higher than expected.
BTC/USD 1-hour chart. Source: Cointelegraph/TradingView
Bitcoin wobbles as PCE comes in hot
Data from Cointelegraph Markets Pro and TradingView showed BTC/USD heading to $85,500 at the Wall Street open before reversing.
Down over 3% on the day, the pair saw lows under $84,500 on Bitstamp, marking its lowest levels since March 23.
The February print of the US Personal Consumption Expenditures (PCE) Index subsequently showed inflation quickening — in contrast to the result from a month prior.
While the month-on-month and year-on-year PCE tally conformed to market forecasts at 0.3% and 2.5%, respectively, their core PCE equivalents were both 0.1% higher than anticipated.
“Core inflation is back on the rise,” trading resource The Kobeissi Letter concluded in part of a response on X, noting that the January numbers had also been revised higher.
Kobeissi argued that the current macroeconomic trajectory forms “the perfect recipe for stagflation in 2025.”
“March inflation data will be even more telling as the trade war rages on,” it wrote.
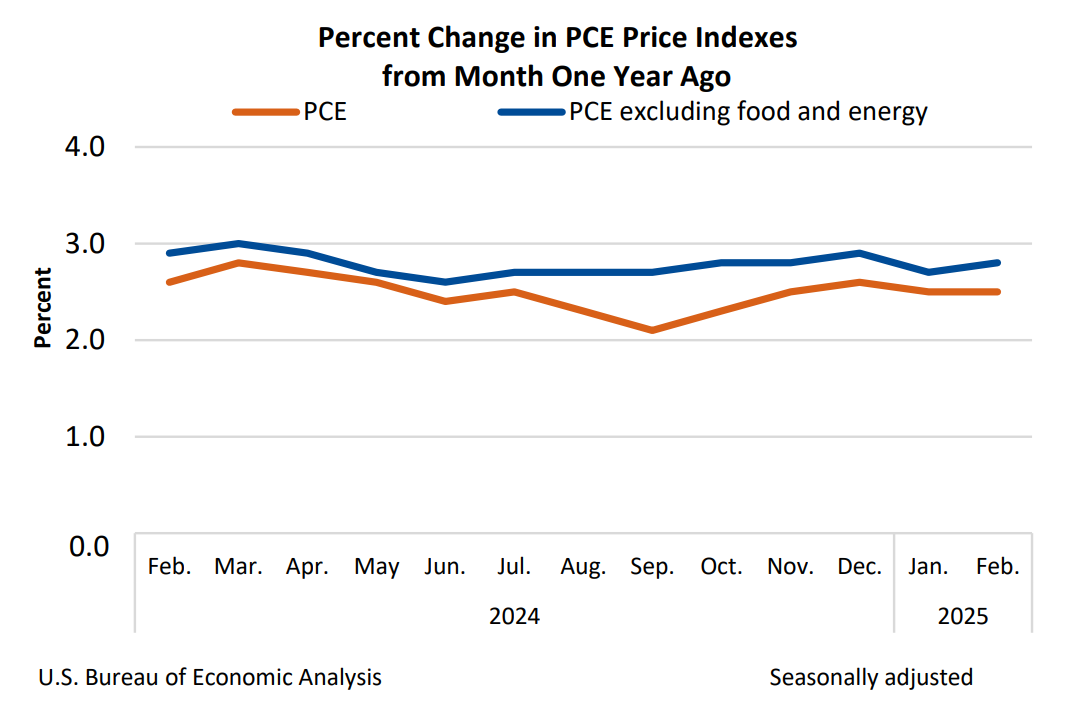
US PCE % change (screenshot). Source: Bureau of Economic Analysis
BTC price analysis sees “typical market cooldown”
While BTC price action appeared to shake off the inflation warning, market participants were ready for surprises.
Related: ‘Bitcoin Macro Index’ bear signal puts $110K BTC price return in doubt
“PCE data coming up so it’s going to be a volatile day in the markets I reckon,” popular trader Daan Crypto Trades thus wrote in part of his own X reaction.
Others maintained doubts over broader crypto market strength, agreeing that Bitcoin was not yet out of the woods despite holding above $80,000 for several weeks.
“Trend remains to be upwards for $BTC, but it starts to look slightly less good,” trader, analyst and entrepreneur Michaël van de Poppe told X followers on the day.
“It’s shaking. Drop sub $84K and I think we’ll see a test at $78-80K and perhaps lower before we’ll bounce back up.”
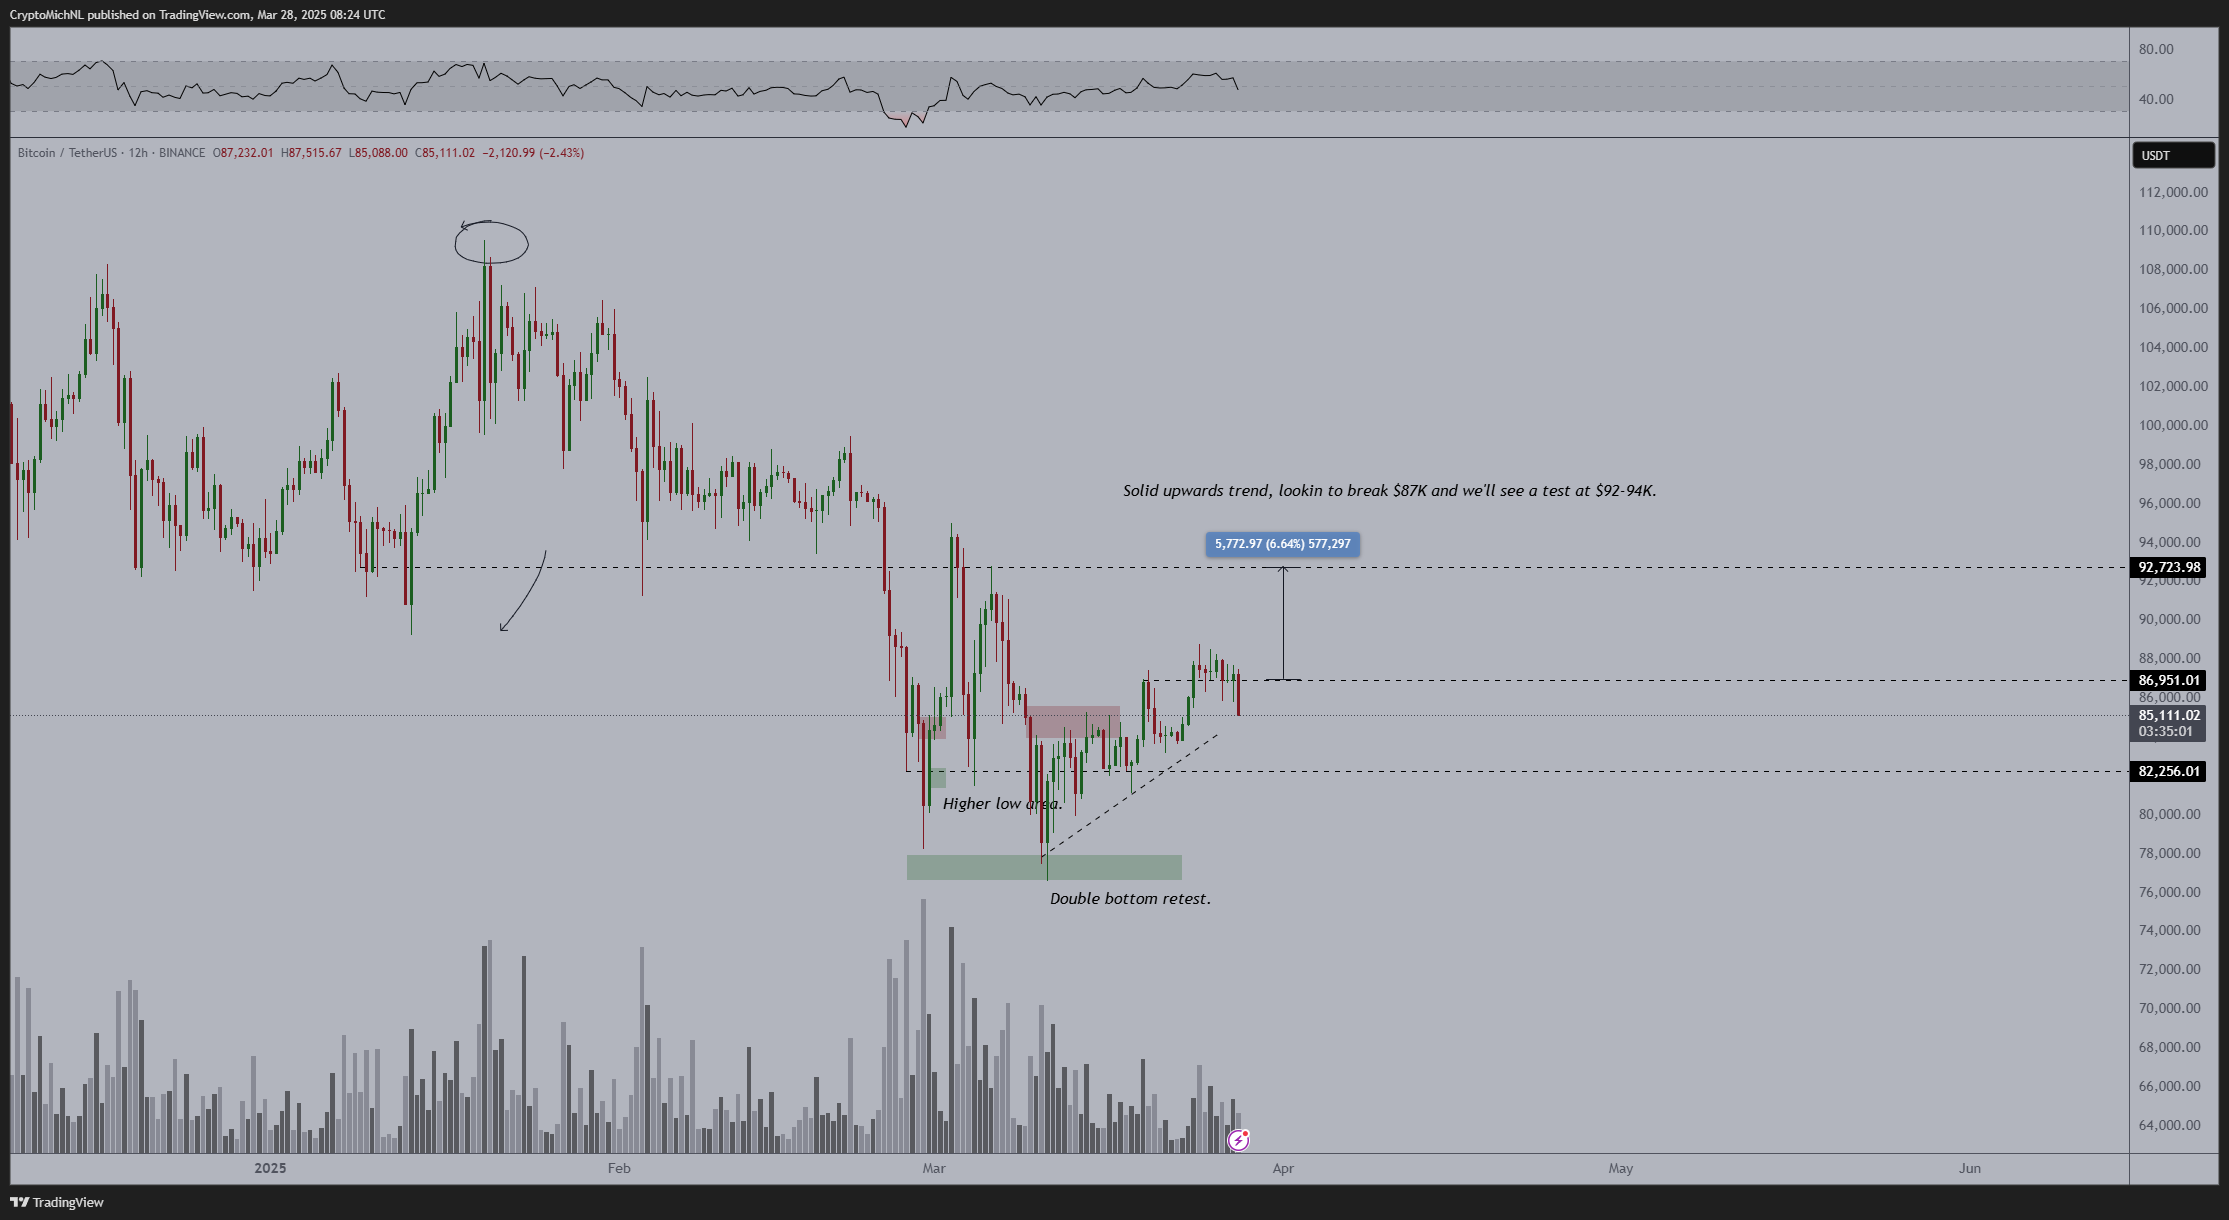
BTC/USDT 12-hour chart with relative strength index (RSI) data. Source: Michaël van de Poppe/X
Fellow trader TheKingfisher likewise saw little chance of a full bullish comeback on short timeframes.
“BTC While the short term price action may suggest a localized squeeze, the broader outlook doesn’t yet support the narrative of a sustained bull run,” he summarized.
“With volatility continuing to decline, current conditions appear more in line with a typical market cooldown. We could be approaching a seasonal reset, potentially front-running the familiar ‘sell in May and go away’ dynamic.”

BTC/USDT 4-hour chart with volume data. Source: TheKingfisher/X
This article does not contain investment advice or recommendations. Every investment and trading move involves risk, and readers should conduct their own research when making a decision.