
Bitcoin (BTC) held steady at the Nov. 21 Wall Street open following a weekly close at levels not seen since late 2020.
Data from Cointelegraph Markets Pro and TradingView showed BTC/USD hovering above $16,000 after dipping below the level overnight.
Sentiment remained on a knife edge as rumors over crypto business conglomerate, Digital Currency Group (DCG) continued to swirl.
Concerns focused on the $10.5 billion investment vehicle, the Grayscale Bitcoin Trust (GBTC), with unsubstantiated talk of possible liquidity problems surfacing across social media.
Coinbase, the GBTC custodian, reportedly confirmed its Bitcoin holdings — over 635,000 BTC — were safe and present on the day.
GBTC was just one of multiple potential victims in the ongoing meltdown of exchange FTX and its related businesses, however, and crypto prices remained highly sensitive to the topic.
Traders and analysts thus lined up to deliver short-term BTC price targets, these perhaps unsurprisingly being mostly to the downside.
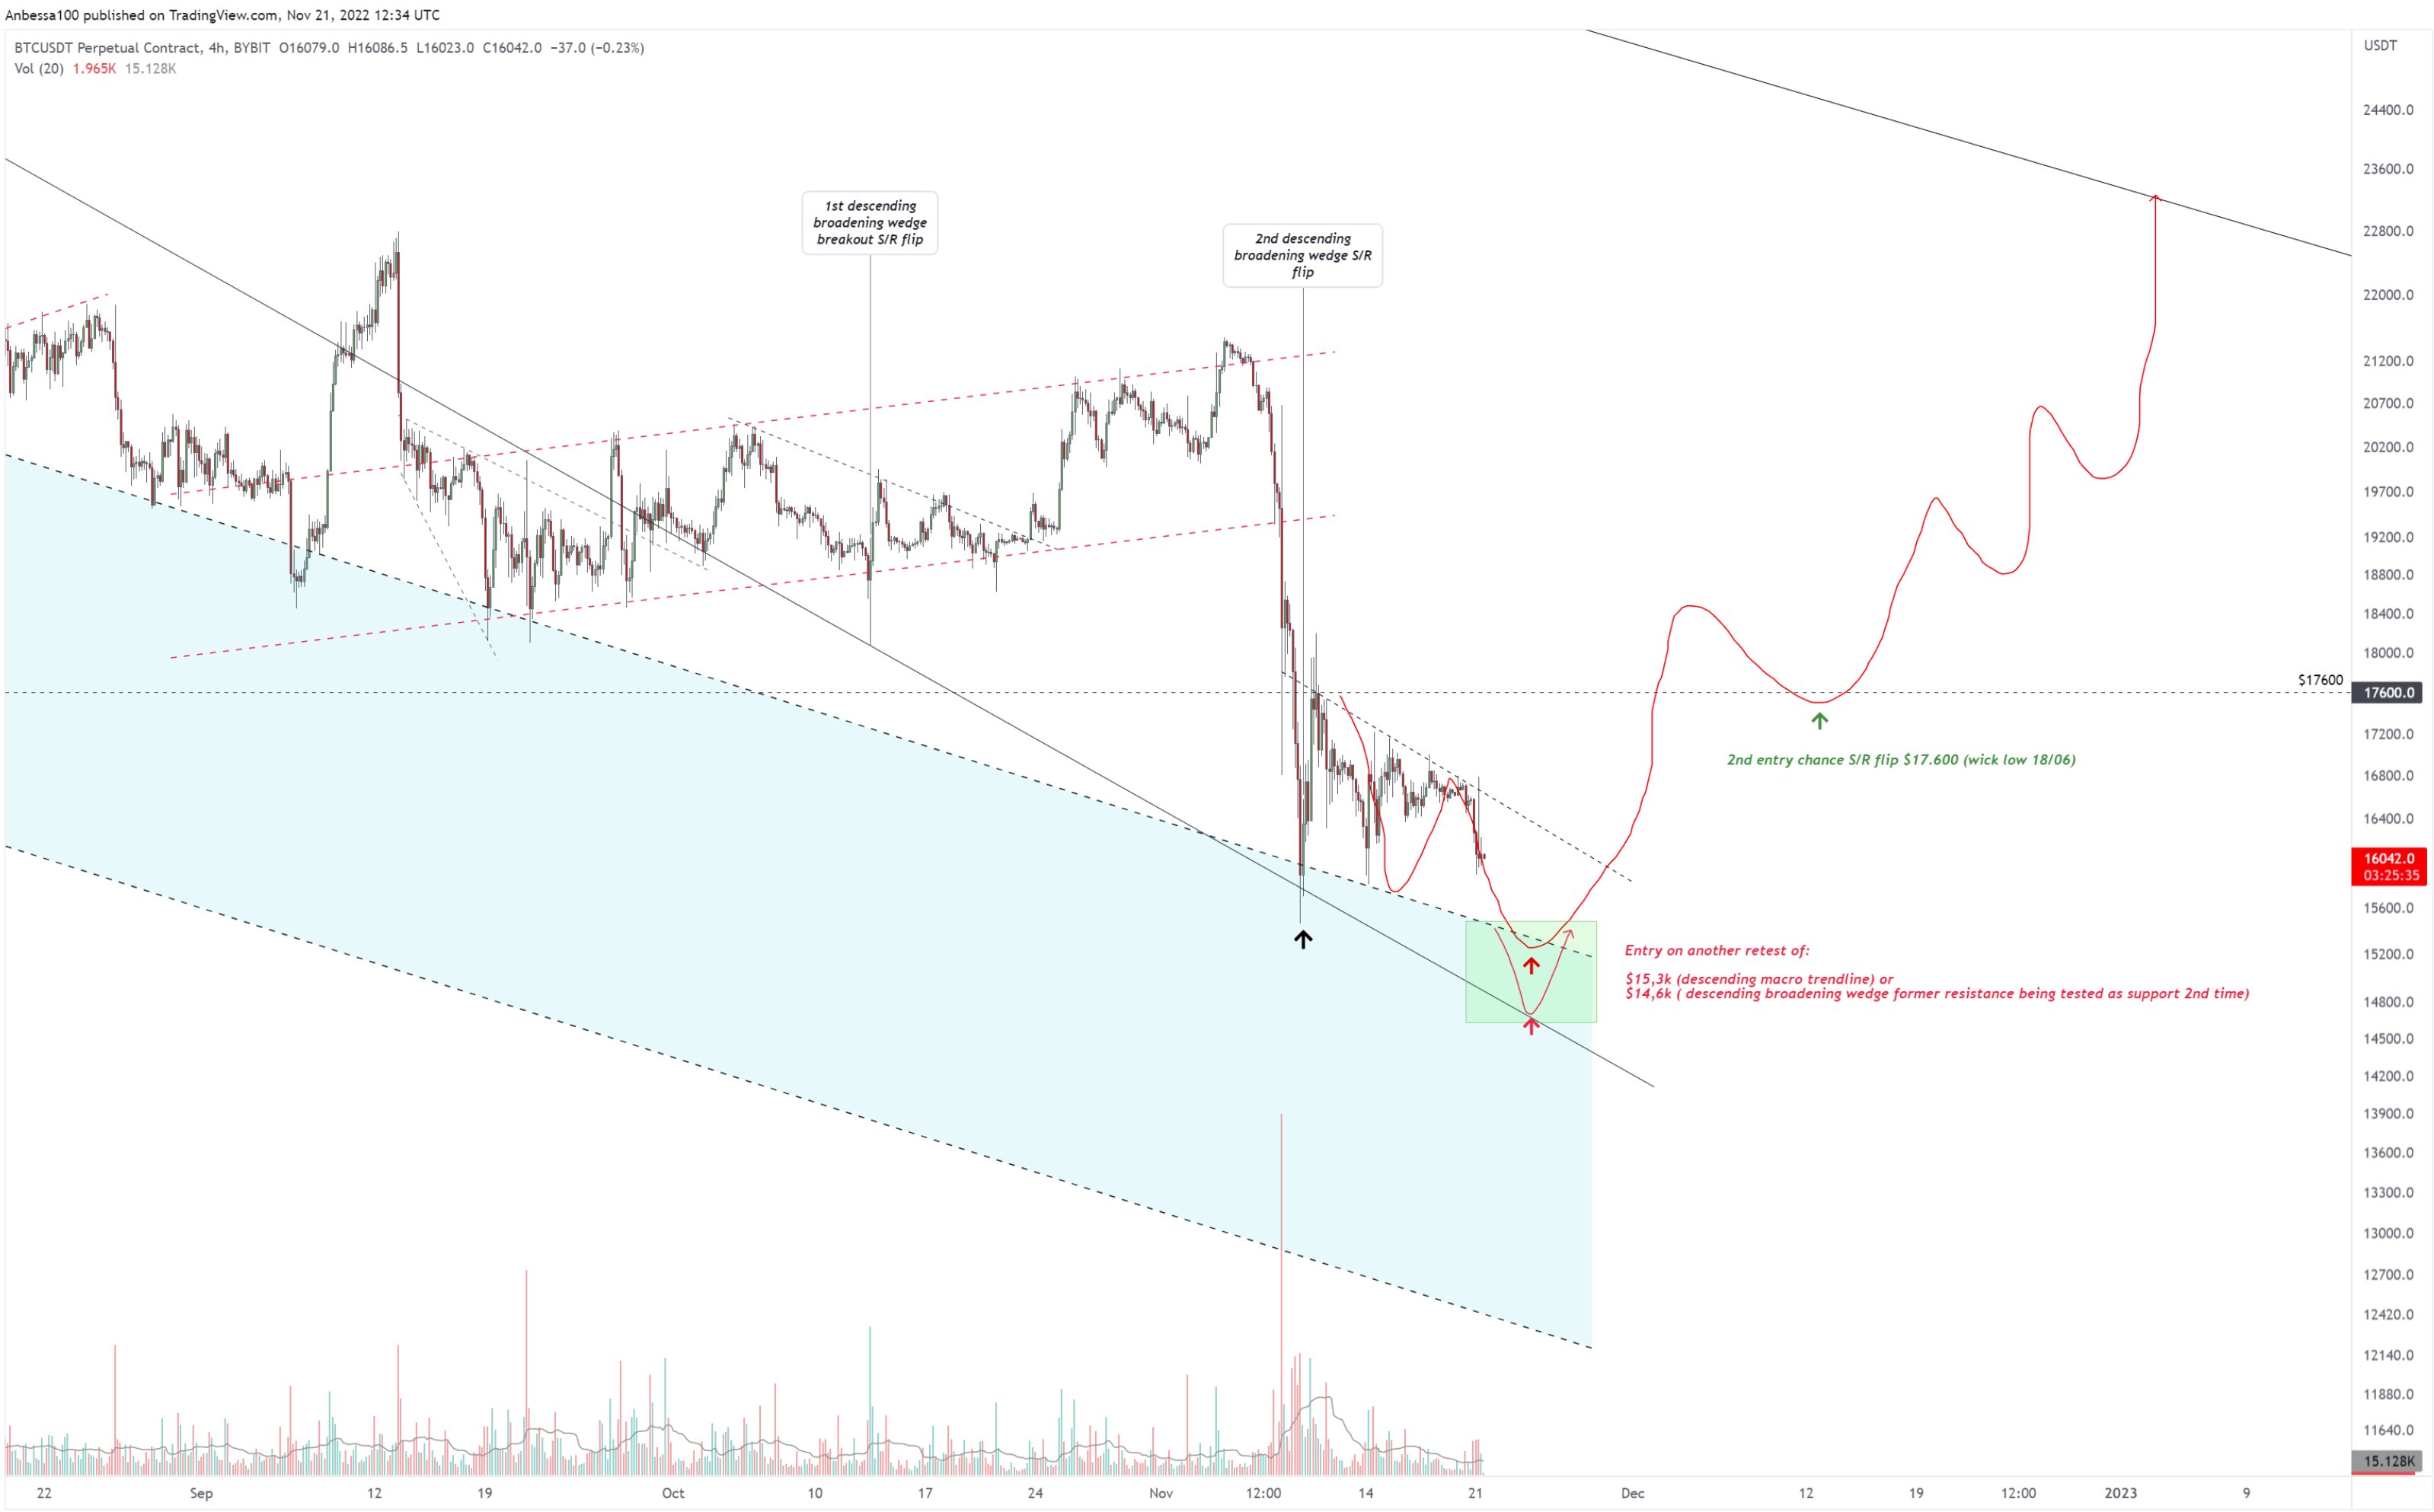
Anbessa: $14,600, $15,300, $17,580
Popular Twitter commentator Anbessa laid out the case for BTC/USD retesting lower levels next, but also offered a reentry level should market strength return.
Updating a Twitter discussion with an annotated chart, he highlighted $14,600 as a “most primed” area to increase BTC exposure.
“Time has passed, and the plan hasn’t changed. The re-entry is a bit lower now (descending trendline support),” he summarized in accompanying comments.
If Bitcoin were to halt its descent now, Anbessa said that a reentry point would be just below $17,600 — the site of June’s previous macro low. BTC/USD would need to flip it to support for the strategy to be valid.
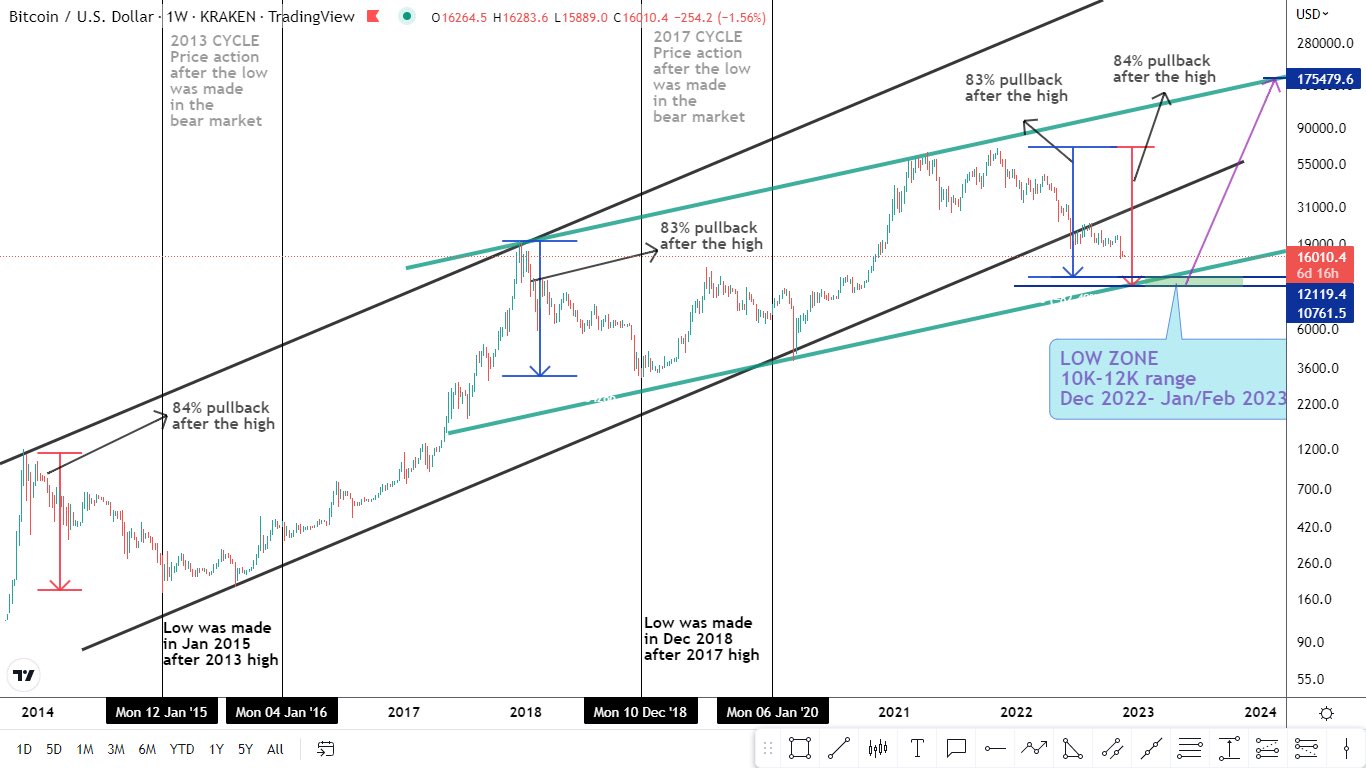
The London Crypto: $12,000, $175,000
Like several others, The London Crypto, partner of exchange ByBit, believes that the ultimate bear market low lies around $12,000 for Bitcoin.
He arrived at the calculation using historical drawdowns from all-time highs.
For every cycle low, there is a high, however, and optimistic The London Crypto was not shy about predicting the good times returning around Bitcoin’s next block subsidy halving.
“BTC has made a 77% correction in this bear market, compared to 84% in 2013 and 83% in 2017,” he noted.
“Studying our previous cycles high vs lows, we can estimate the low for this bear to be the $10k-$12k range, followed by a high of $175k in 2024-2025.”
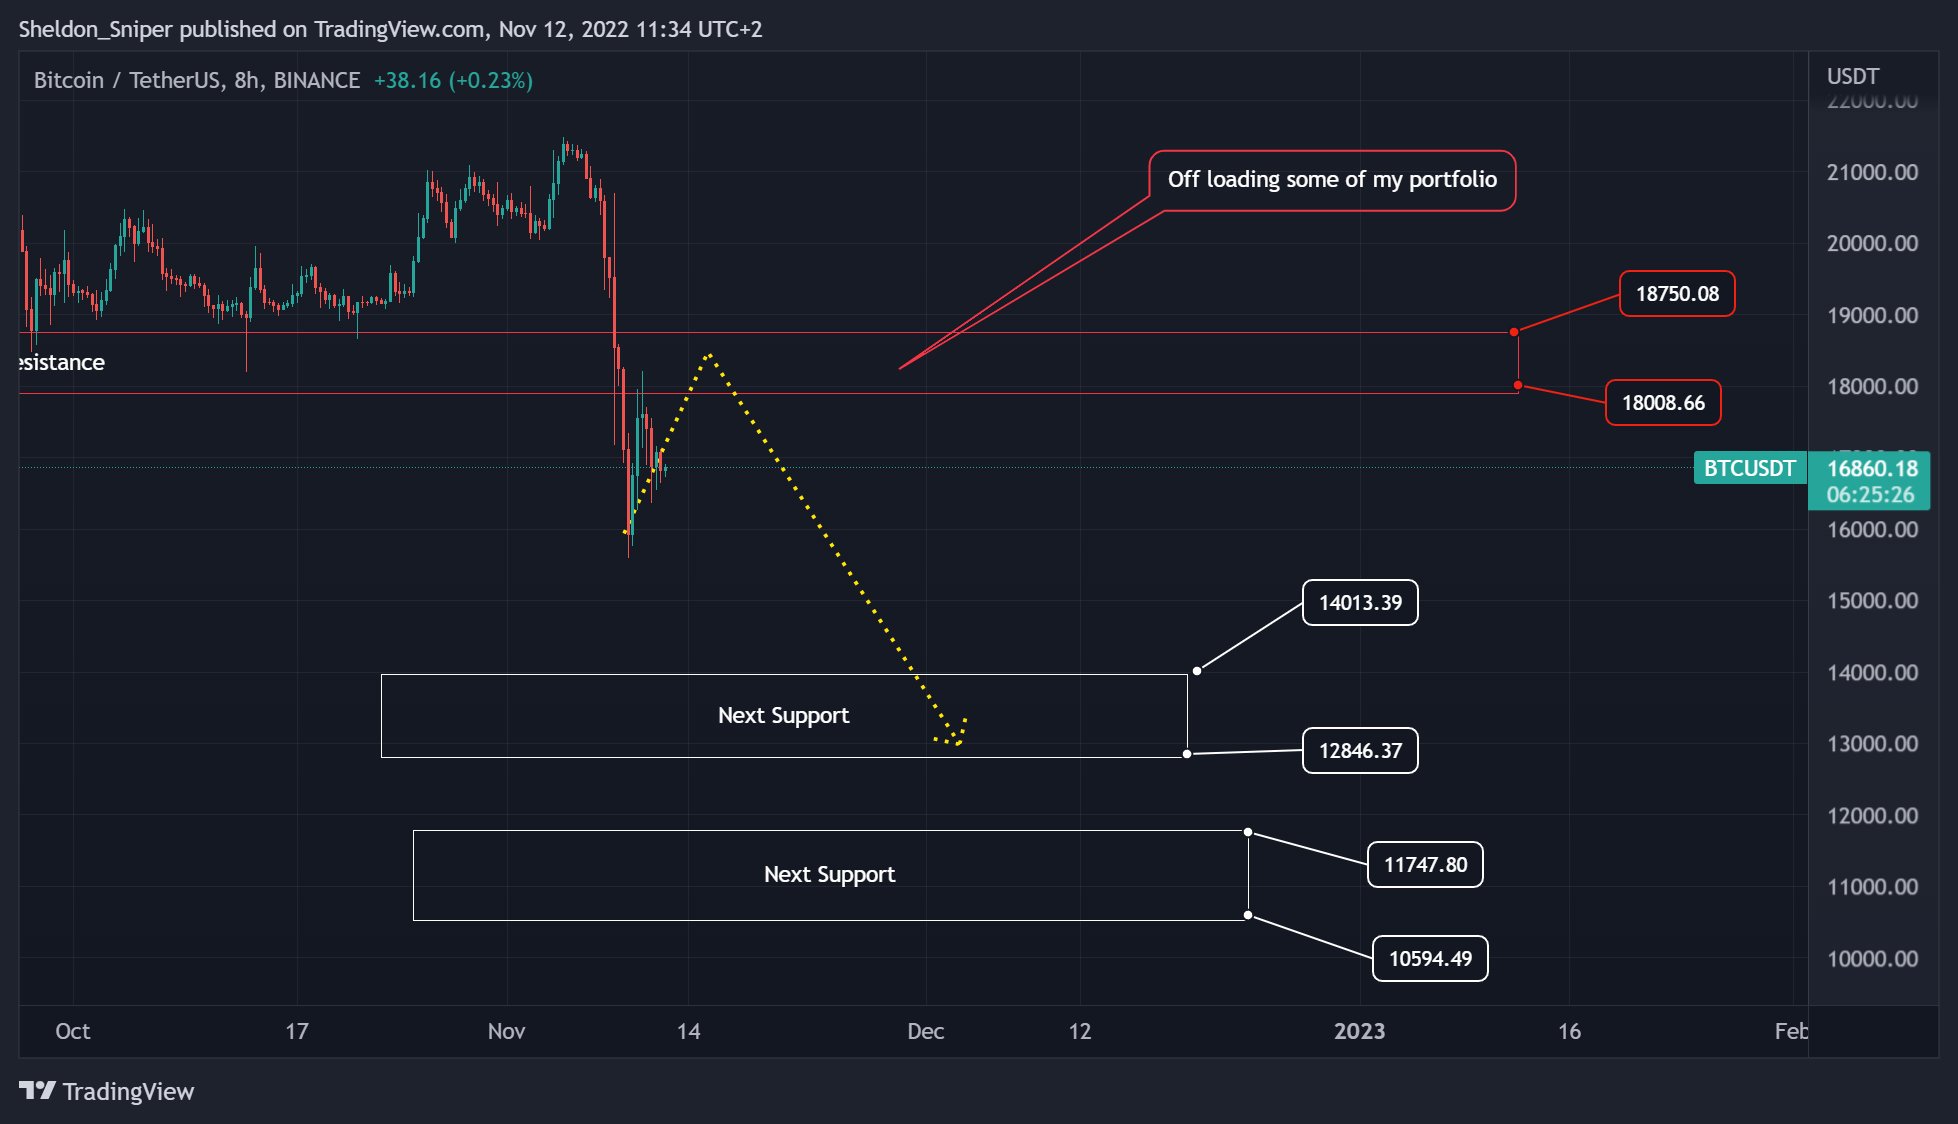
Sheldon the Sniper: $12,000-$13,000
His sentiment was shared by Sheldon the Sniper on the day, who gave a rough target of $12,000-$13,000.
A bounce past $18,000 would trigger “offloading” of his BTC portfolio, a further tweet stated, with several downside targets crystalizing at the same time.
These came in the form of various support zones at $14,013, $12,846, $11,747 and $10,594.
“Drop may happen before offload zone but lets see,” he added.
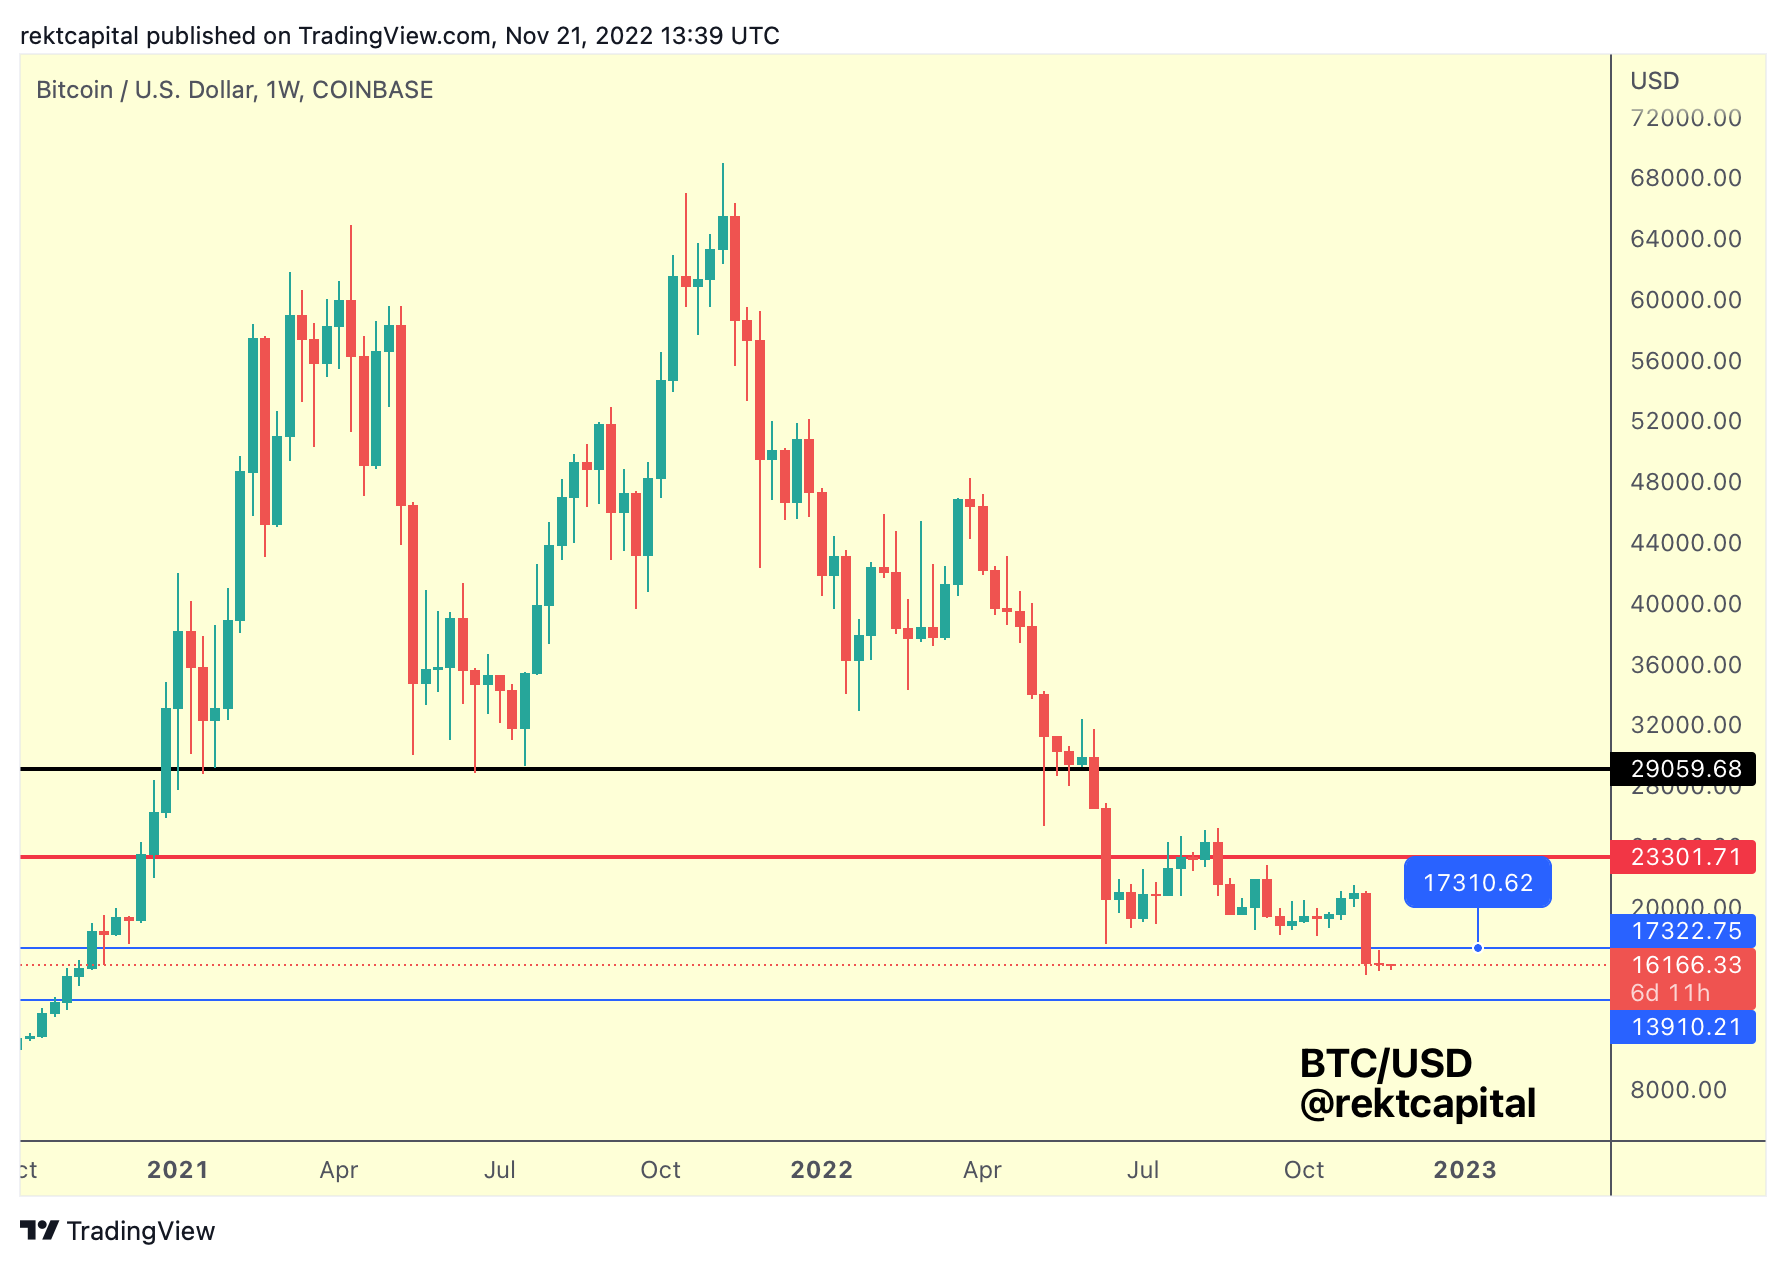
Rekt Capital: Key weekly levels
Analyst Rekt Capital meanwhile flagged important support and resistance zones in the form of closing prices on the weekly chart.
Related: GBTC next BTC price black swan? — 5 things to know in Bitcoin this week
At $16,250, BTC/USD closed its latest weekly candle over $1,000 below “key resistance” at $17,322, he warned.
Uploading a summary chart, further important levels were $13,910 to the downside and $23,300 to the upside.
“New BTC Weekly Close occurs below the key resistance,” he noted.
“Price has performed a small rejection but no substantial downside follow-through as of yet.”
The views, thoughts and opinions expressed here are the authors’ alone and do not necessarily reflect or represent the views and opinions of Cointelegraph.


