
Bitcoin (BTC) traded nearer $17,000 on Jan. 7 after the end of the year’s first trading week delivered a spike higher.
All eyes on CPI
Data from Cointelegraph Markets Pro and TradingView followed BTC/USD as it briefly passed the $17,000 mark the day prior.
The pair had seen flash volatility on the back of fresh economic data from the United States, this nonetheless fading to leave the key level “unflipped” as resistance.
Nonetheless, the brief uptick delivered Bitcoin’s highest price point since Dec. 20, 2022.
Reacting, market participants continued to look to next week’s Consumer Price Index (CPI) print as a key potential catalyst for risk assets.
“Unemployment will rally in the coming months. Yields will fall of a cliff if CPI is low,” Michaël van de Poppe, founder and CEO of trading firm Eight, wrote in part of a summary tweet on Jan. 6.
“Relief rally is close.”
“Finally looks like BTC is ready to break out of the $16K – $17K base range it’s been stuck in the past several weeks. Initiate the squeeze,” hopeful trader Kaleo continued.
Should the CPI data show inflation decreasing quicker than expected, meanwhile, it could provide fuel for a trip to multi-month highs near $19,000, futures trader Satoshi Flipper added.
Data reveals extent of on-chain losses
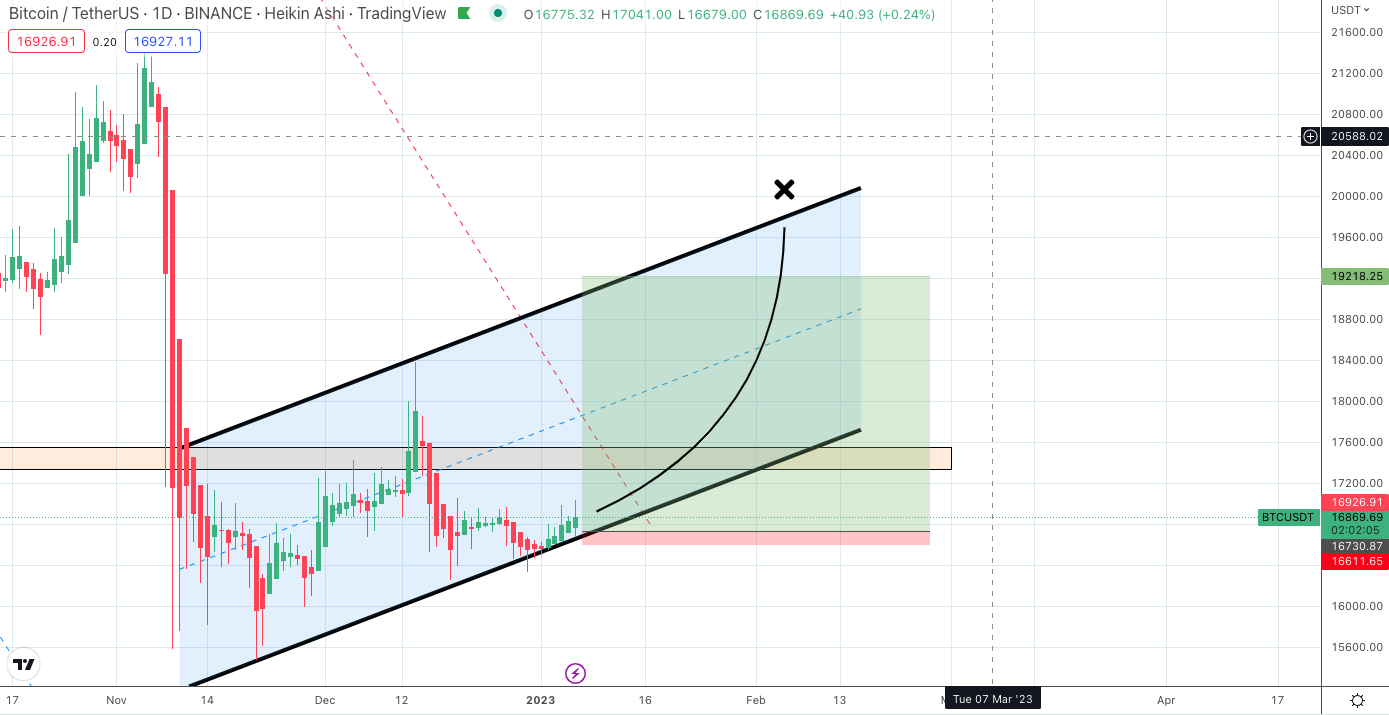
Zooming out, fellow trader and analyst Rekt Capital joined the growing consensus over the current narrow trading range on BTC/USD forming the next macro bottom zone.
Related: $16.8K Bitcoin now trades further below this key trendline than ever
“The current BTC price action will likely figure as an important cluster in the formation of the Bear Market bottom Accumulation Range,” he determined.
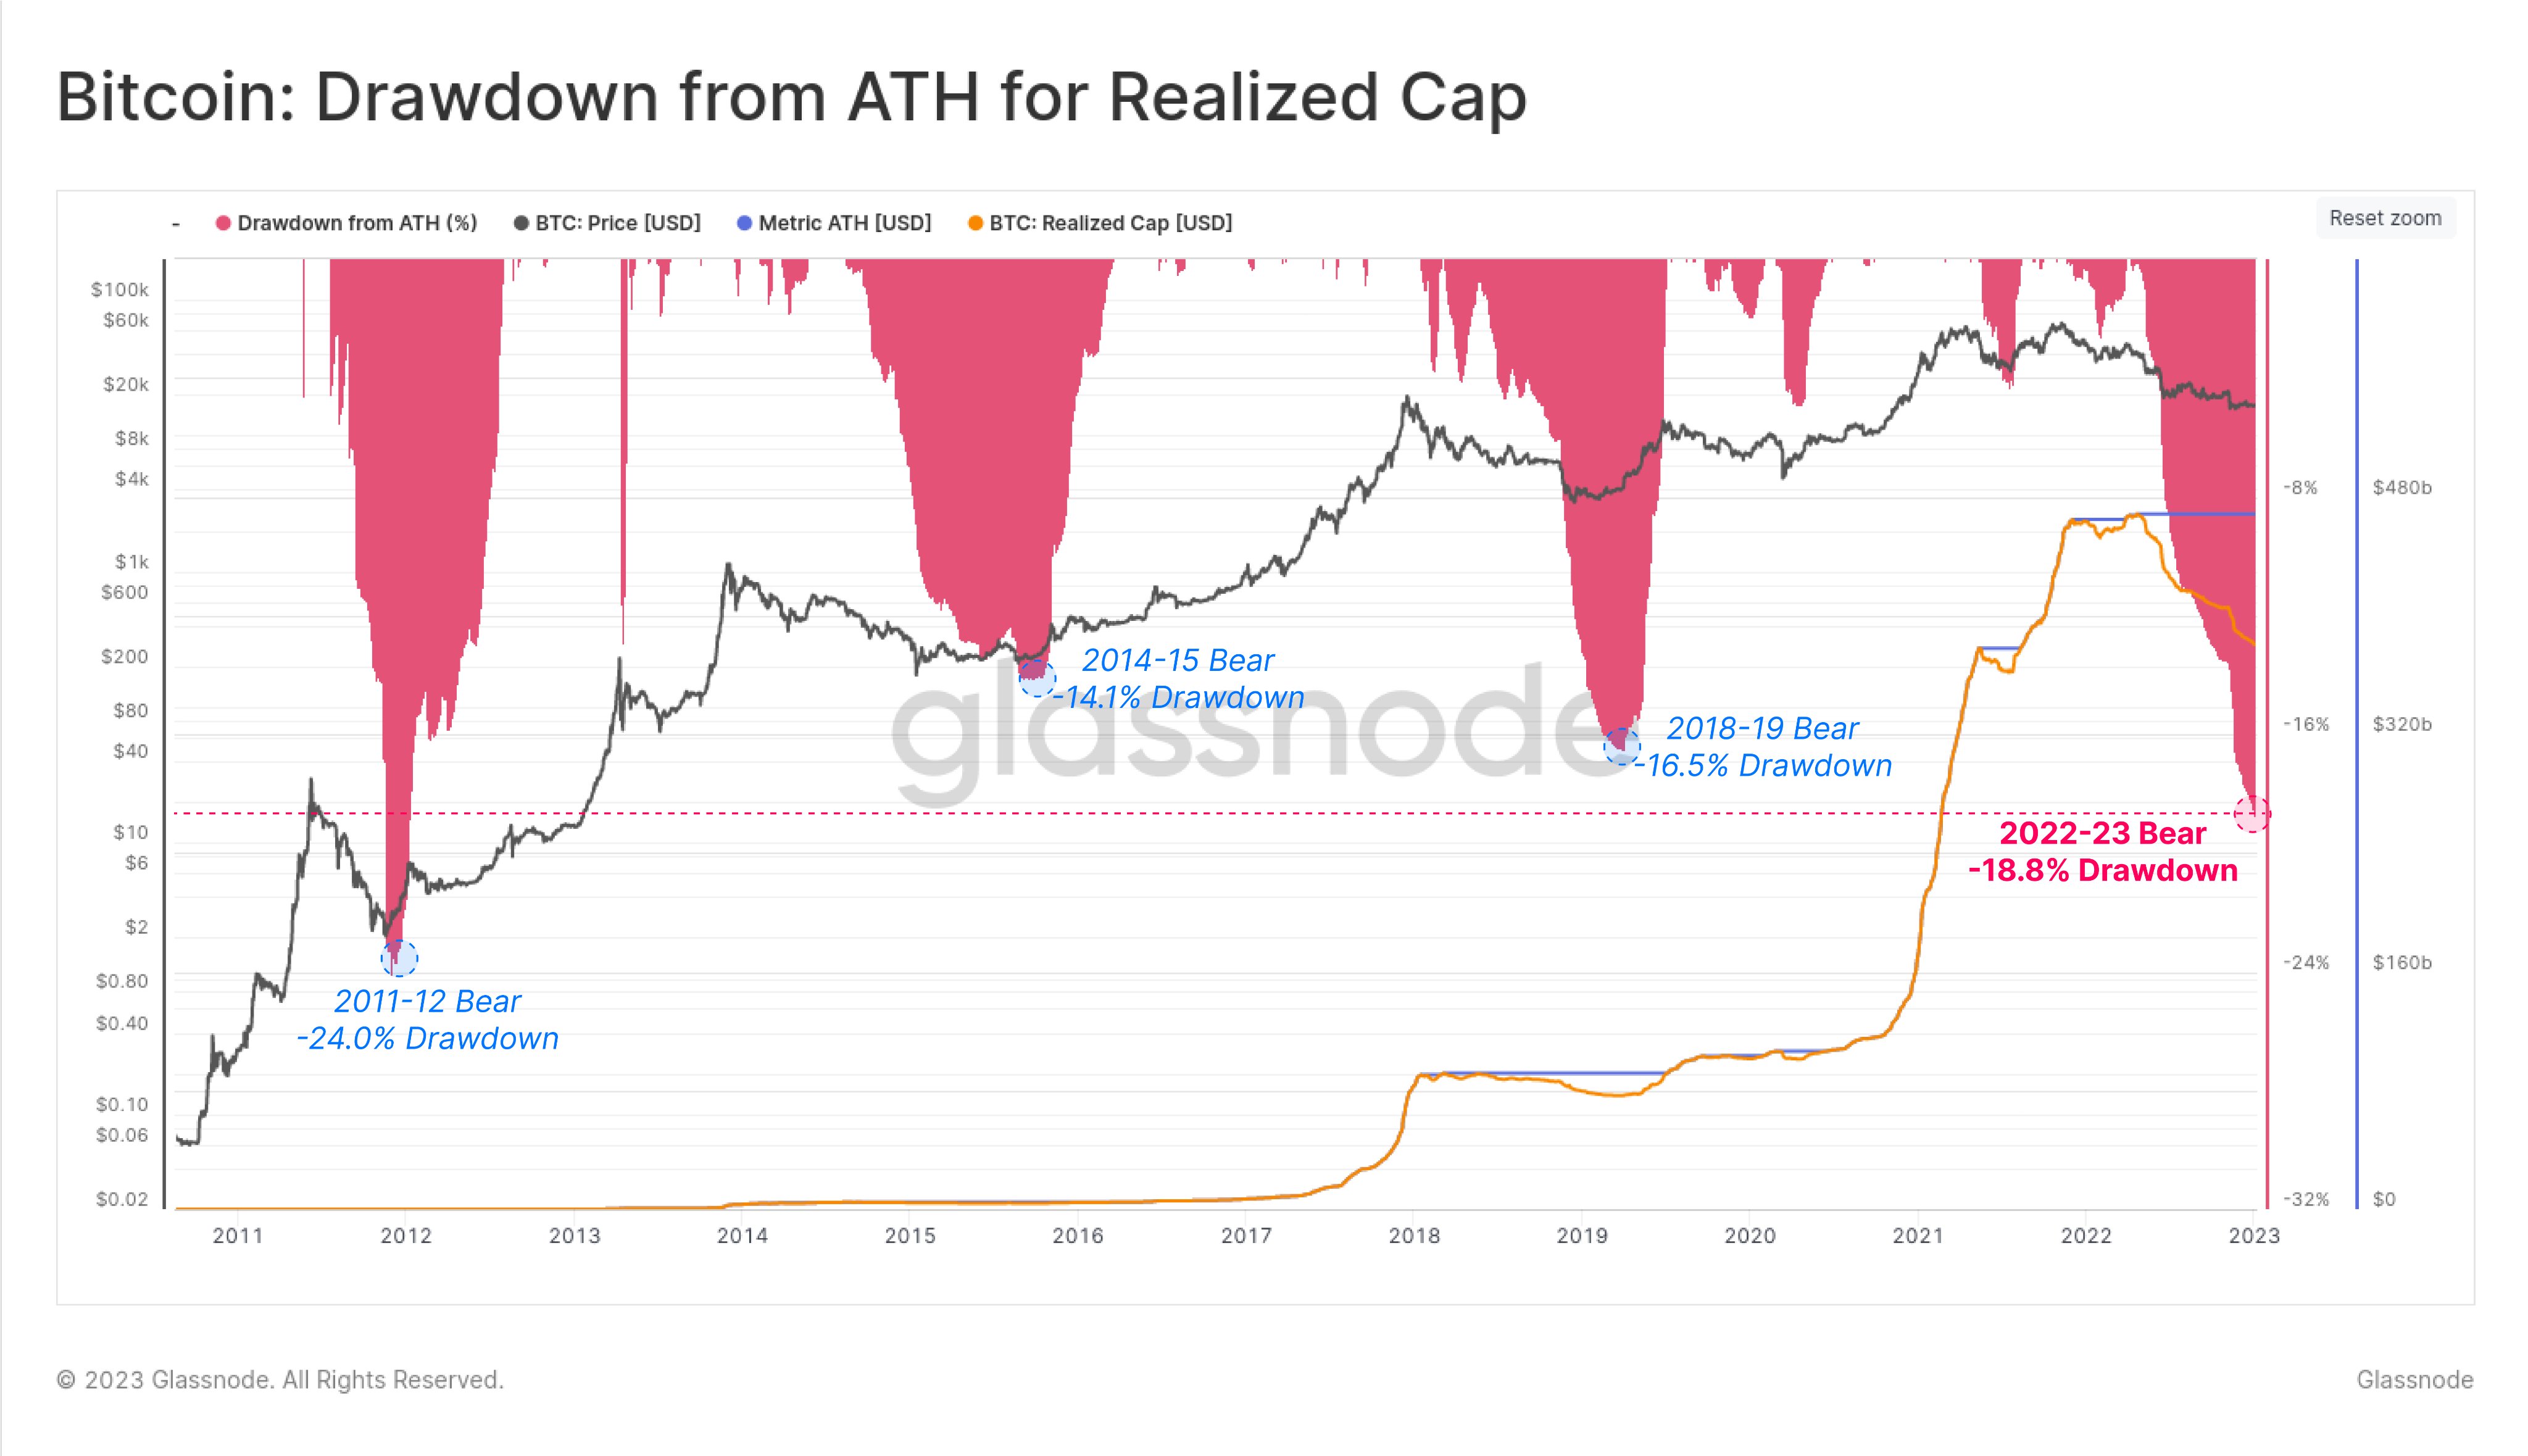
In a further demonstration of the pain already being endured by hodlers, on-chain analytics firm Glassnode showed that Bitcoin has seen its second-largest realized cap drawdown.
Realized cap describes the aggregate price at which the BTC supply last moved, and its decrease reflects realized losses from selling.
“The 2022-23 Bitcoin Bear Market has seen the Realized cap drawdown by -18.8%, the second largest in history, and eclipsed only by the pico-bottom of the 2011 bear,” Checkmate, Glassnode’s lead on-chain analyst, commented alongside a chart.
“Investors have weathered a total of $88 Billion in Net Realized losses.”
The views, thoughts and opinions expressed here are the authors’ alone and do not necessarily reflect or represent the views and opinions of Cointelegraph.


