
Bitcoin surged nearly 10% and broke the $22,000 resistance zone against the US Dollar. BTC could correct lower, but the bulls might be active near $21,250.
- Bitcoin jumped and broke a major hurdle near the $22,000 zone.
- The price is now trading above the $21,500 level and the 100 hourly simple moving average.
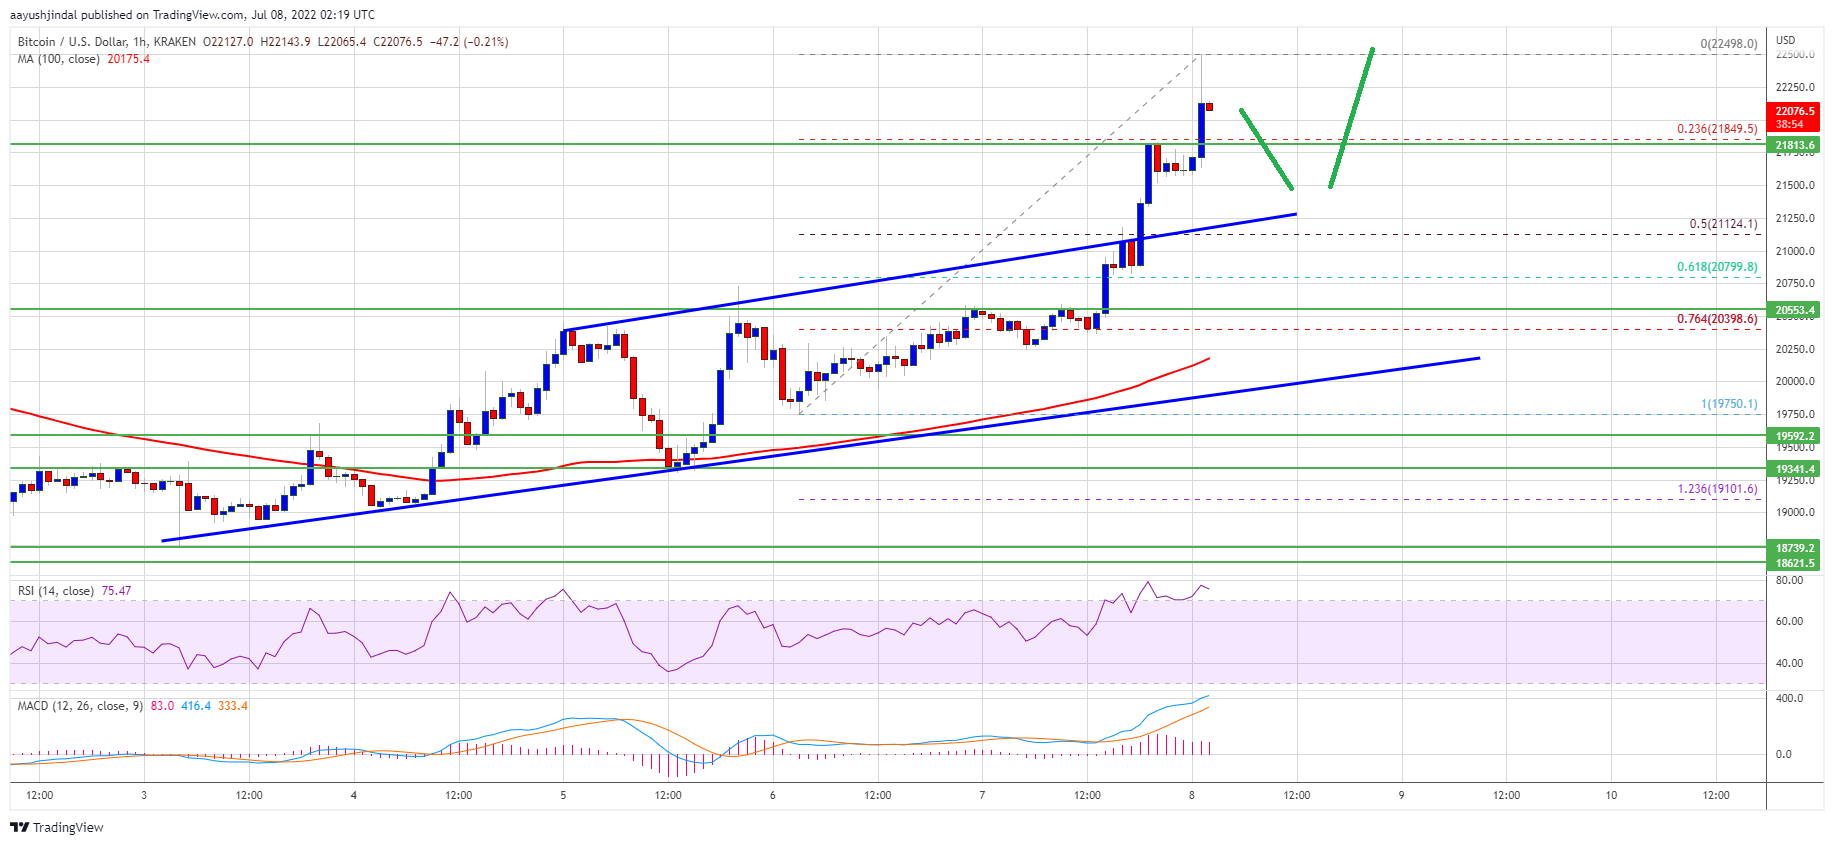
- There was a break above a key rising channel with resistance near $21,125 on the hourly chart of the BTC/USD pair (data feed from Kraken).
- The pair could correct lower, but the bulls might be able to protect the $21,250 support.
Bitcoin Price Starts Fresh Surge
Bitcoin price formed a base above the $20,000 level. BTC started a strong increase by clearing the $20,500 and $20,800 resistance levels.
There was a sharp increase and the price climbed above the $21,500 level. It even broke the $22,000 hurdle and settled above the 100 hourly simple moving average. A high is formed near $22,498 and the price is now consolidating gains.
It is trading well above the 23.6% Fib retracement level of the recent increase from the $19,750 swing low to $22,498 high. On the upside, the price is facing resistance near the $22,450 and $22,500 levels.
Source: BTCUSD on TradingView.com
The next key resistance is near the $22,800 zone. A close above the $22,800 resistance zone could set the pace for a test of the $23,200 level. Any more gains might open the doors for an increase towards the $24,000 level. The next major resistance sits near the $25,000 level.
Dips Supported in BTC?
If bitcoin fails to clear the $22,500 resistance zone, it could start a downside correction. An immediate support on the downside is near the $21,850 level.
The next major support now sits near the $21,250 level or the broken channel trend line zone. It is near the 50% Fib retracement level of the recent increase from the $19,750 swing low to $22,498 high. A close below the $21,250 support zone could push the price to $20,500. In the stated case, there is a risk of a move towards the $20,000 level.
Technical indicators:
Hourly MACD – The MACD is now losing pace in the bullish zone.
Hourly RSI (Relative Strength Index) – The RSI for BTC/USD is now in the overbought zone.
Major Support Levels – $21,850, followed by $21,250.
Major Resistance Levels – $22,500, $22,800 and $23,200.


