
Bitcoin (BTC) price is showing notable resilience at the $17,000 level, and according to data from Glassnode, a number of metrics that track the pace of selling and the on-chain behavior of investors are beginning to show a reduction in the factors that trigger sharp sell-offs.
The FTX bankruptcy fueled a historic sell-off resulting in $4.4 billion in realized Bitcoin losses. By analyzing realized losses with the daily weighted average metric, Glassnode analysts found that the on-chain losses are subsiding.
According to Glassnode, Bitcoin hit an all-time low in the realized profits versus losses ratio. Toward the end of the most recent bull market, realized losses were 14 times larger than profits, which historically coincided with a positive market shift.
The on-chain data also shows realized losses are declining and Bitcoin price is above the balanced price and realized cap is dropping, removing excess liquidity generated from over-leveraged entities.
Realized cap suggests excess liquidity is drained
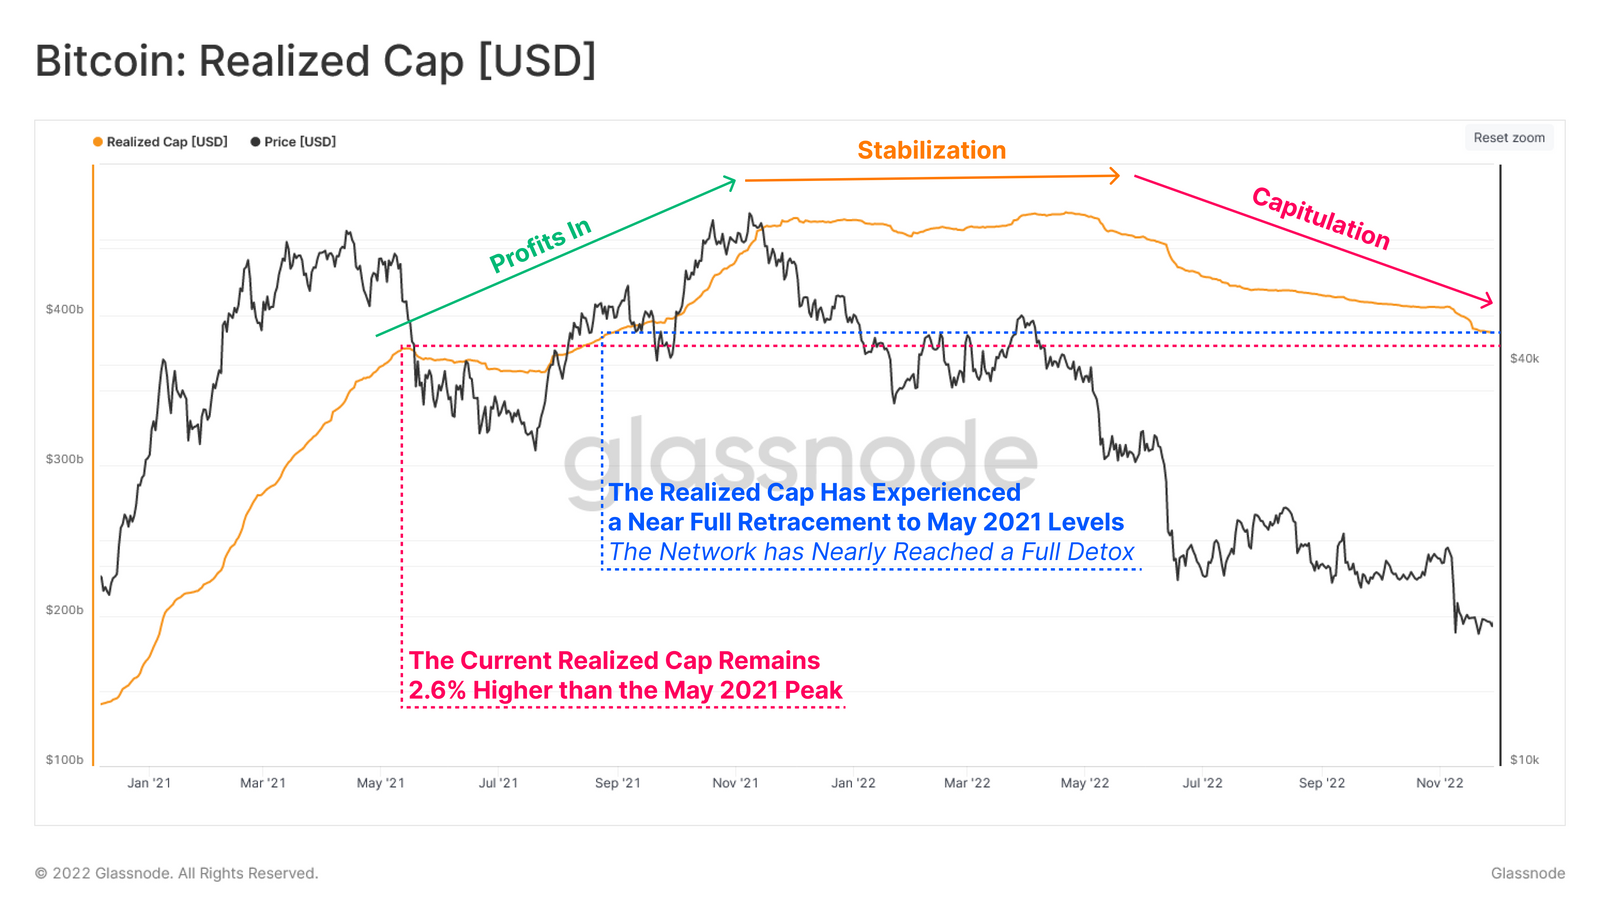
The realized cap is the net sum of Bitcoin capital inflows and outflows since BTC’s launch.
The current realized cap is 2.6% higher than the May 2021 peak, suggesting that Bitcoin’s all-time high has retraced and all excess liquidity from bad debt and over-leveraged entities has been drained from the market.
In the past, as bad debt was removed from the ecosystem, a launch pad for future bull markets was established.
According to the analysts:
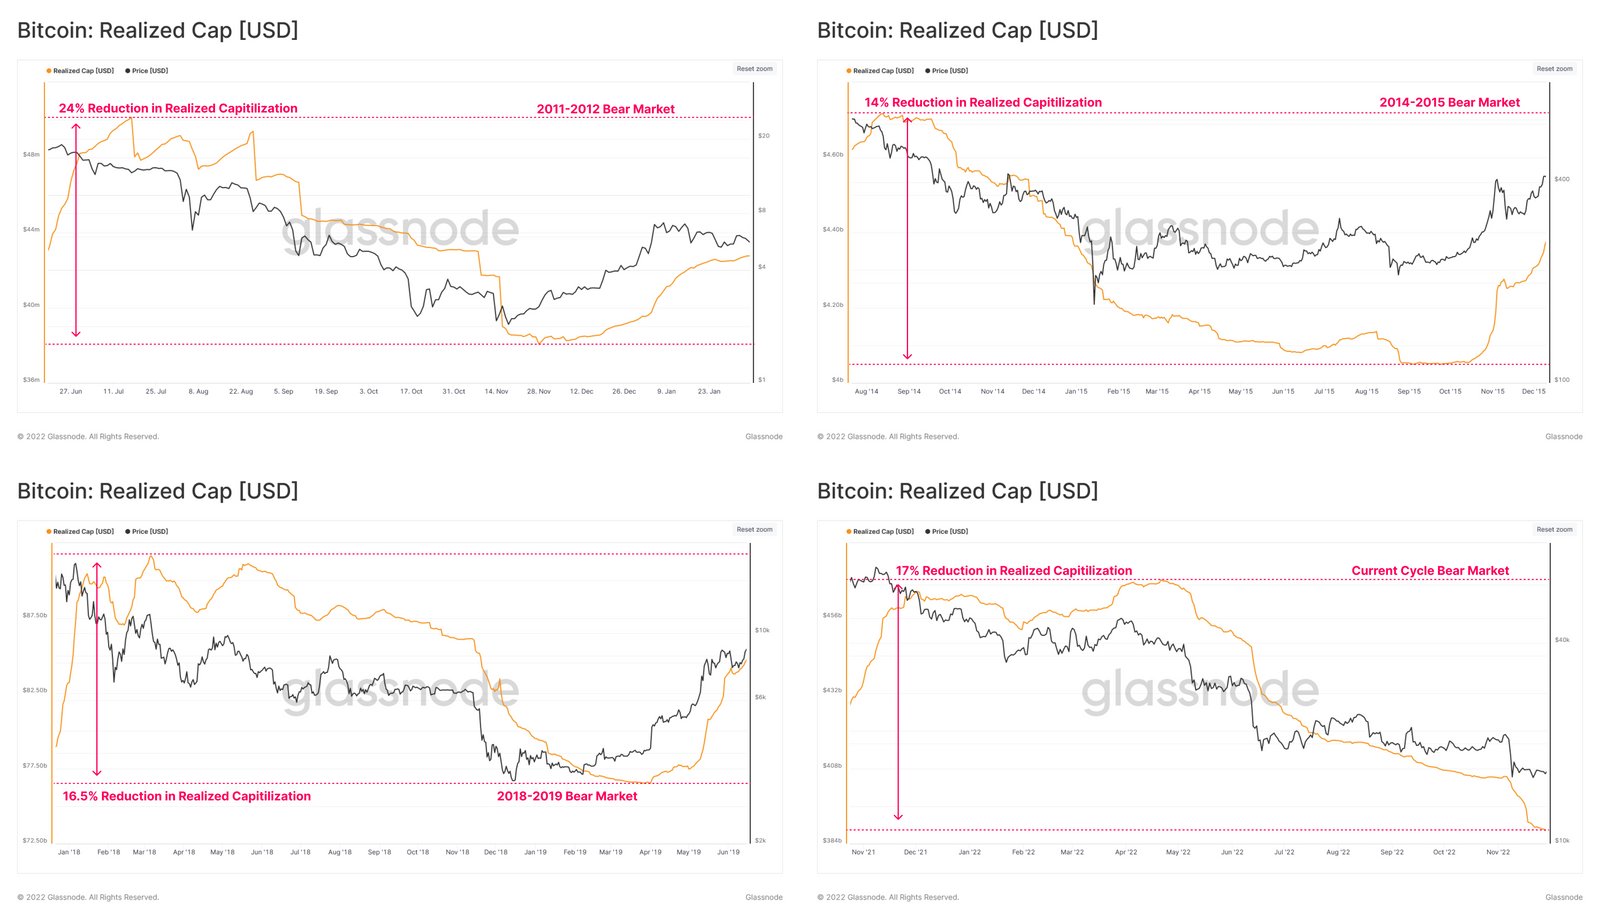
“The 2010-11 realized cap saw a net capital outflow equivalent to 24% of the peak. The 2014-15 realized cap experienced the lowest, yet non-trivial capital outflow of 14%. The 2017-18 recorded a 16.5% decline in realized cap, the closest to the current cycle of 17.0%. By this measure, the current cycle has seen the third largest relative outflow of capital, and has now eclipsed the 2018 cycle, which is arguably the most relevant mature market analogue.”
The bottom could possibly be in
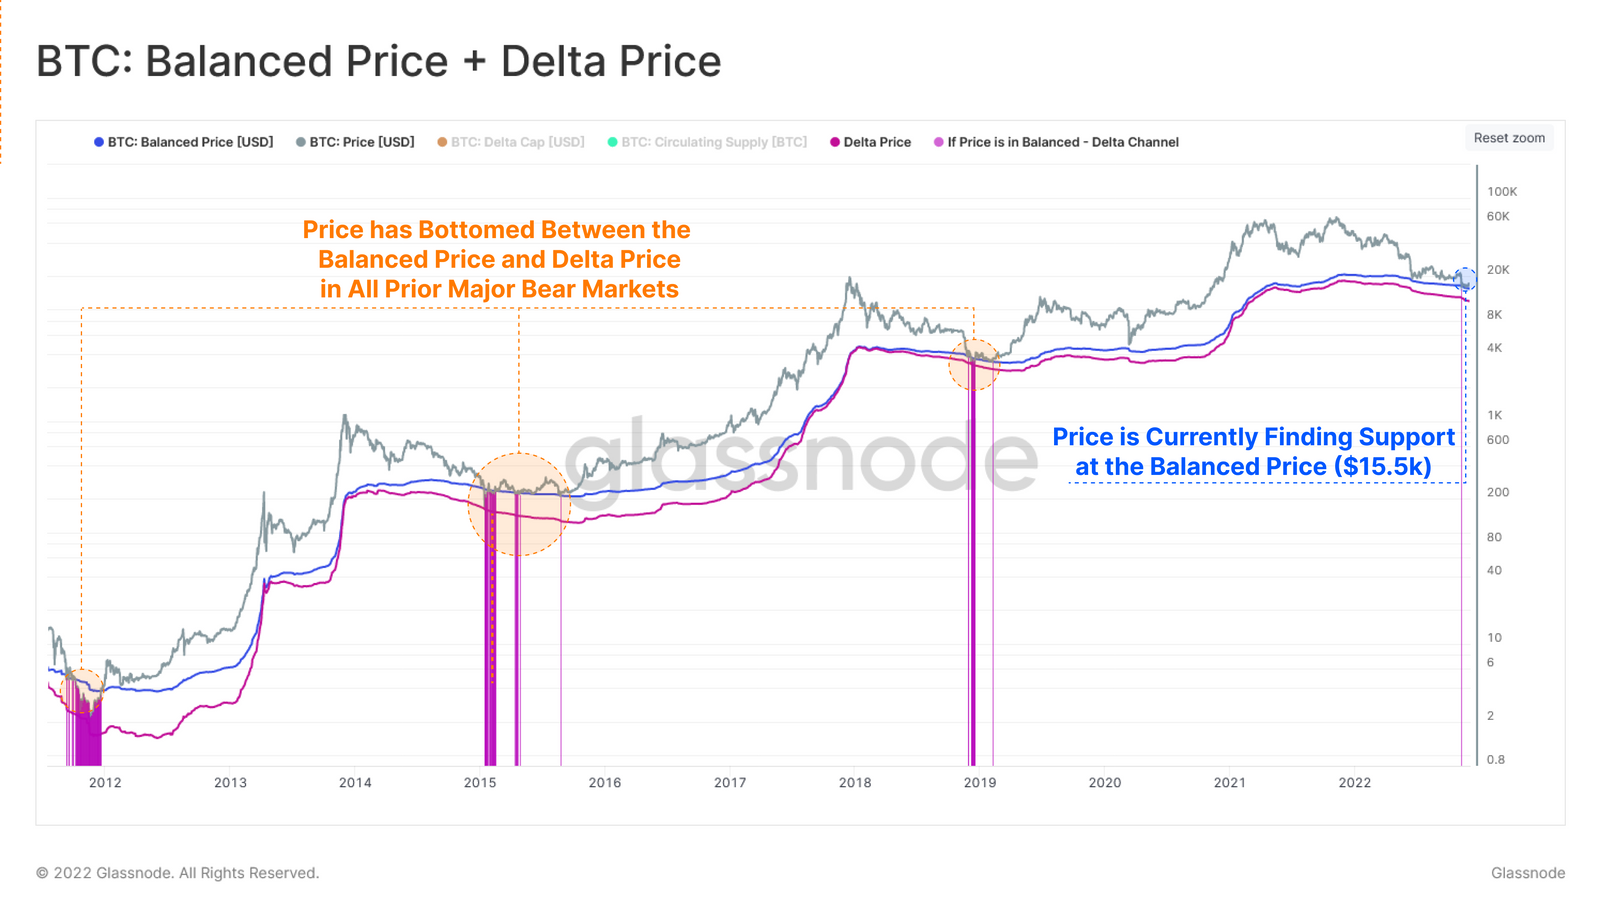
Balanced price and delta price are algorithmic analyses used to revisit previous bear cycles. In previous bear cycles, Bitcoin’s price has traded between the balanced price and the delta price 3.0% of the time.
The current balanced price range is between $12,000 and $15,500 with the current delta price concentrating between $18,700 to $22,900. Concurrent with previous bear markets, Bitcoin’s price is above the balanced price, finding support at $15,500.
Related: BTC price levels to watch as Bitcoin holds $17K into the market open
While a market bottom has yet to be found, and a handful of potential downside catalysts remain, on-chain analysis is showing that the sentiment of market participants is slowly shifting out of bearish extremes, with the peak of realized losses and forced selling seemingly concluded.
A tighter view of Bitcoin holders’ acquisition cost will also make anticipating reactions to possible upcoming volatility easier. A large amount of excess liquidity has dissipated, possibly creating a firmer price floor for a sustainable BTC price recovery.
The views, thoughts and opinions expressed here are the authors’ alone and do not necessarily reflect or represent the views and opinions of Cointelegraph.


