Bitcoin is currently consolidating above the key $8,500 support area against the US Dollar. BTC price could start a fresh rally if it clears the $8,800 resistance area.
- Bitcoin price is confined in a range above the main $8,500 support against the US Dollar.
- The bulls are facing hurdles near the $8,760 and $8,800 resistance levels.
- There is a key contracting triangle forming with resistance near $8,720 on the hourly chart of the BTC/USD pair (data feed from Kraken).
- The pair could either rally above $8,800 or start a downside extension below $8,470.
Bitcoin Sighting Upside Break
Yesterday, we discussed a downside correction in bitcoin from well above the $9,000 level against the US Dollar. BTC price followed a short term bearish path and broke the $8,800 support area.
Moreover, there was a close below the $8,800 level and the 100 hourly simple moving average. Finally, bitcoin tested the key $8,500 support area and recently started a tiny recovery.
The price tested the $8,500 support area on multiple occasions, but the bears failed to gain traction. As a result, the price recovered above the $8,650 level, plus the 23.6% Fib retracement level of the downward move from the $9,186 high to $8,470 swing low.
On the upside, there are a few key hurdles forming near the $8,760 and $8,800 levels for bitcoin. Besides, there is a key contracting triangle forming with resistance near $8,720 on the hourly chart of the BTC/USD pair.
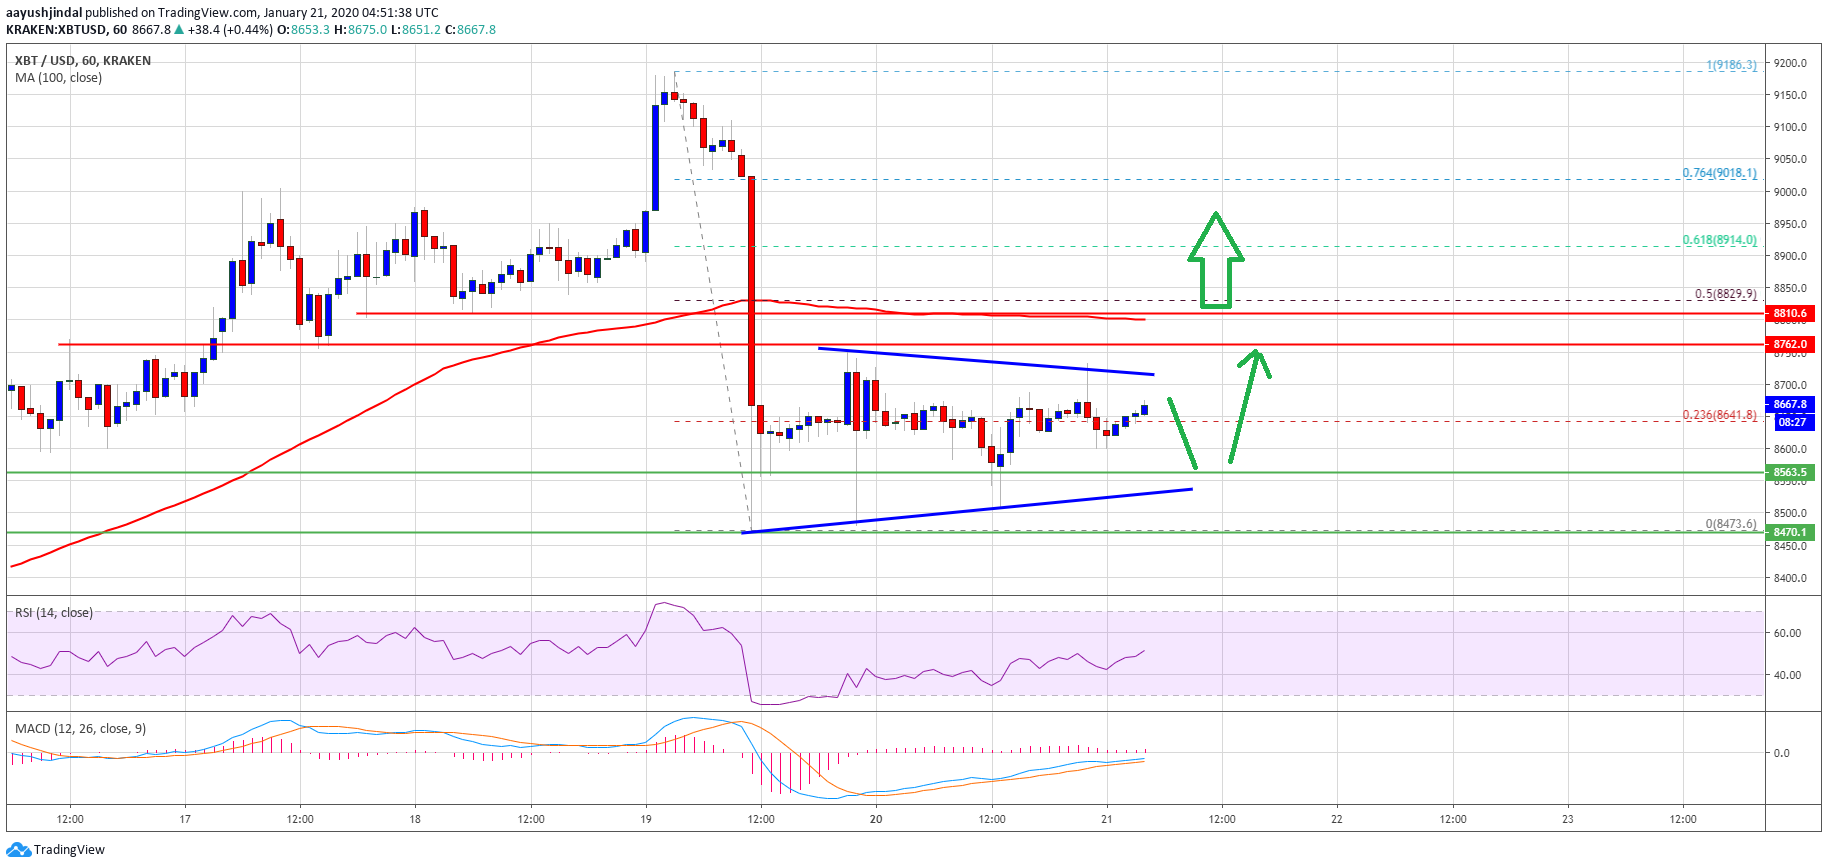
More importantly, the 100 hourly SMA is near the $8,800 level and the 50% Fib retracement level of the downward move from the $9,186 high to $8,470 swing low.
Therefore, a successful break above the $8,800 resistance could start a fresh rally. In the mentioned case, bitcoin price is likely to climb above the $9,000 and $9,100 levels in the near term. Any further gains could lead the price towards $9,300.
Importance of $8,500 for BTC
As mentioned, the $8,500 support area holds a lot of importance for BTC bulls. If the price fails to stay above the $8,500 and $8,470 support levels, there could be another slide.
Below $8,470, bitcoin is likely to extend its losses towards $8,200 or $8,000. The main support is near $8,000, where the bulls are likely to take a stand.
Technical indicators:
Hourly MACD – The MACD is slowly gaining momentum in the bullish zone.
Hourly RSI (Relative Strength Index) – The RSI for BTC/USD is moving higher and it is just above the 50 level.
Major Support Levels – $8,560 followed by $8,500.
Major Resistance Levels – $8,760, $8,800 and $8,830.


