An analyst has explained how profit-taking looks to have finished for Bitcoin in what has been a “very healthy reset” for the market.
Bitcoin SOPR Suggests Profit-Taking From Investors Has Cooled Off
In a new post on X, analyst Willy Woo has discussed about the latest trend occurring in the Bitcoin Spent Output Profit Ratio (SOPR). The SOPR is an on-chain indicator that basically tells us about whether the Bitcoin investors as a whole are selling their coins at a profit or loss right now.
When the value of this metric is greater than 1, it means that the average holder in the sector could be assumed to be moving coins at some net profit currently. On the other hand, the indicator being negative implies loss realization is the dominant mode of selling in the market.
Related Reading
Naturally, the SOPR being exactly equal to 1 suggests the total profits being realized are exactly equal to the losses at the moment and thus, the investors are just breaking-even on their selling.
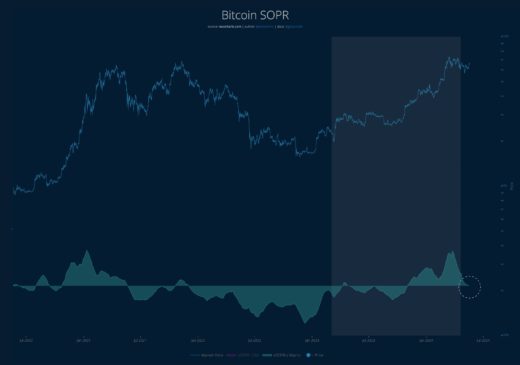
Now, here is a chart that shows the trend in the Bitcoin SOPR over the last few years:
The value of the metric seems to have been neutral in recent days | Source: @woonomic on X
As is visible in the above graph, the Bitcoin SOPR had spiked to highly positive levels earlier when the cryptocurrency’s price had observed its rally towards a new all-time high (ATH).
This would suggest that the investors had been participating in some aggressive profit-taking during this run. From the chart, it’s visible that such a trend was also observed around the start of the 2021 bull run.
With the consolidation, the asset has gone through since the ATH, the indicator’s value has also seen a cooldown. As Woo has highlighted in the chart, the metric has now approached the neutral mark.
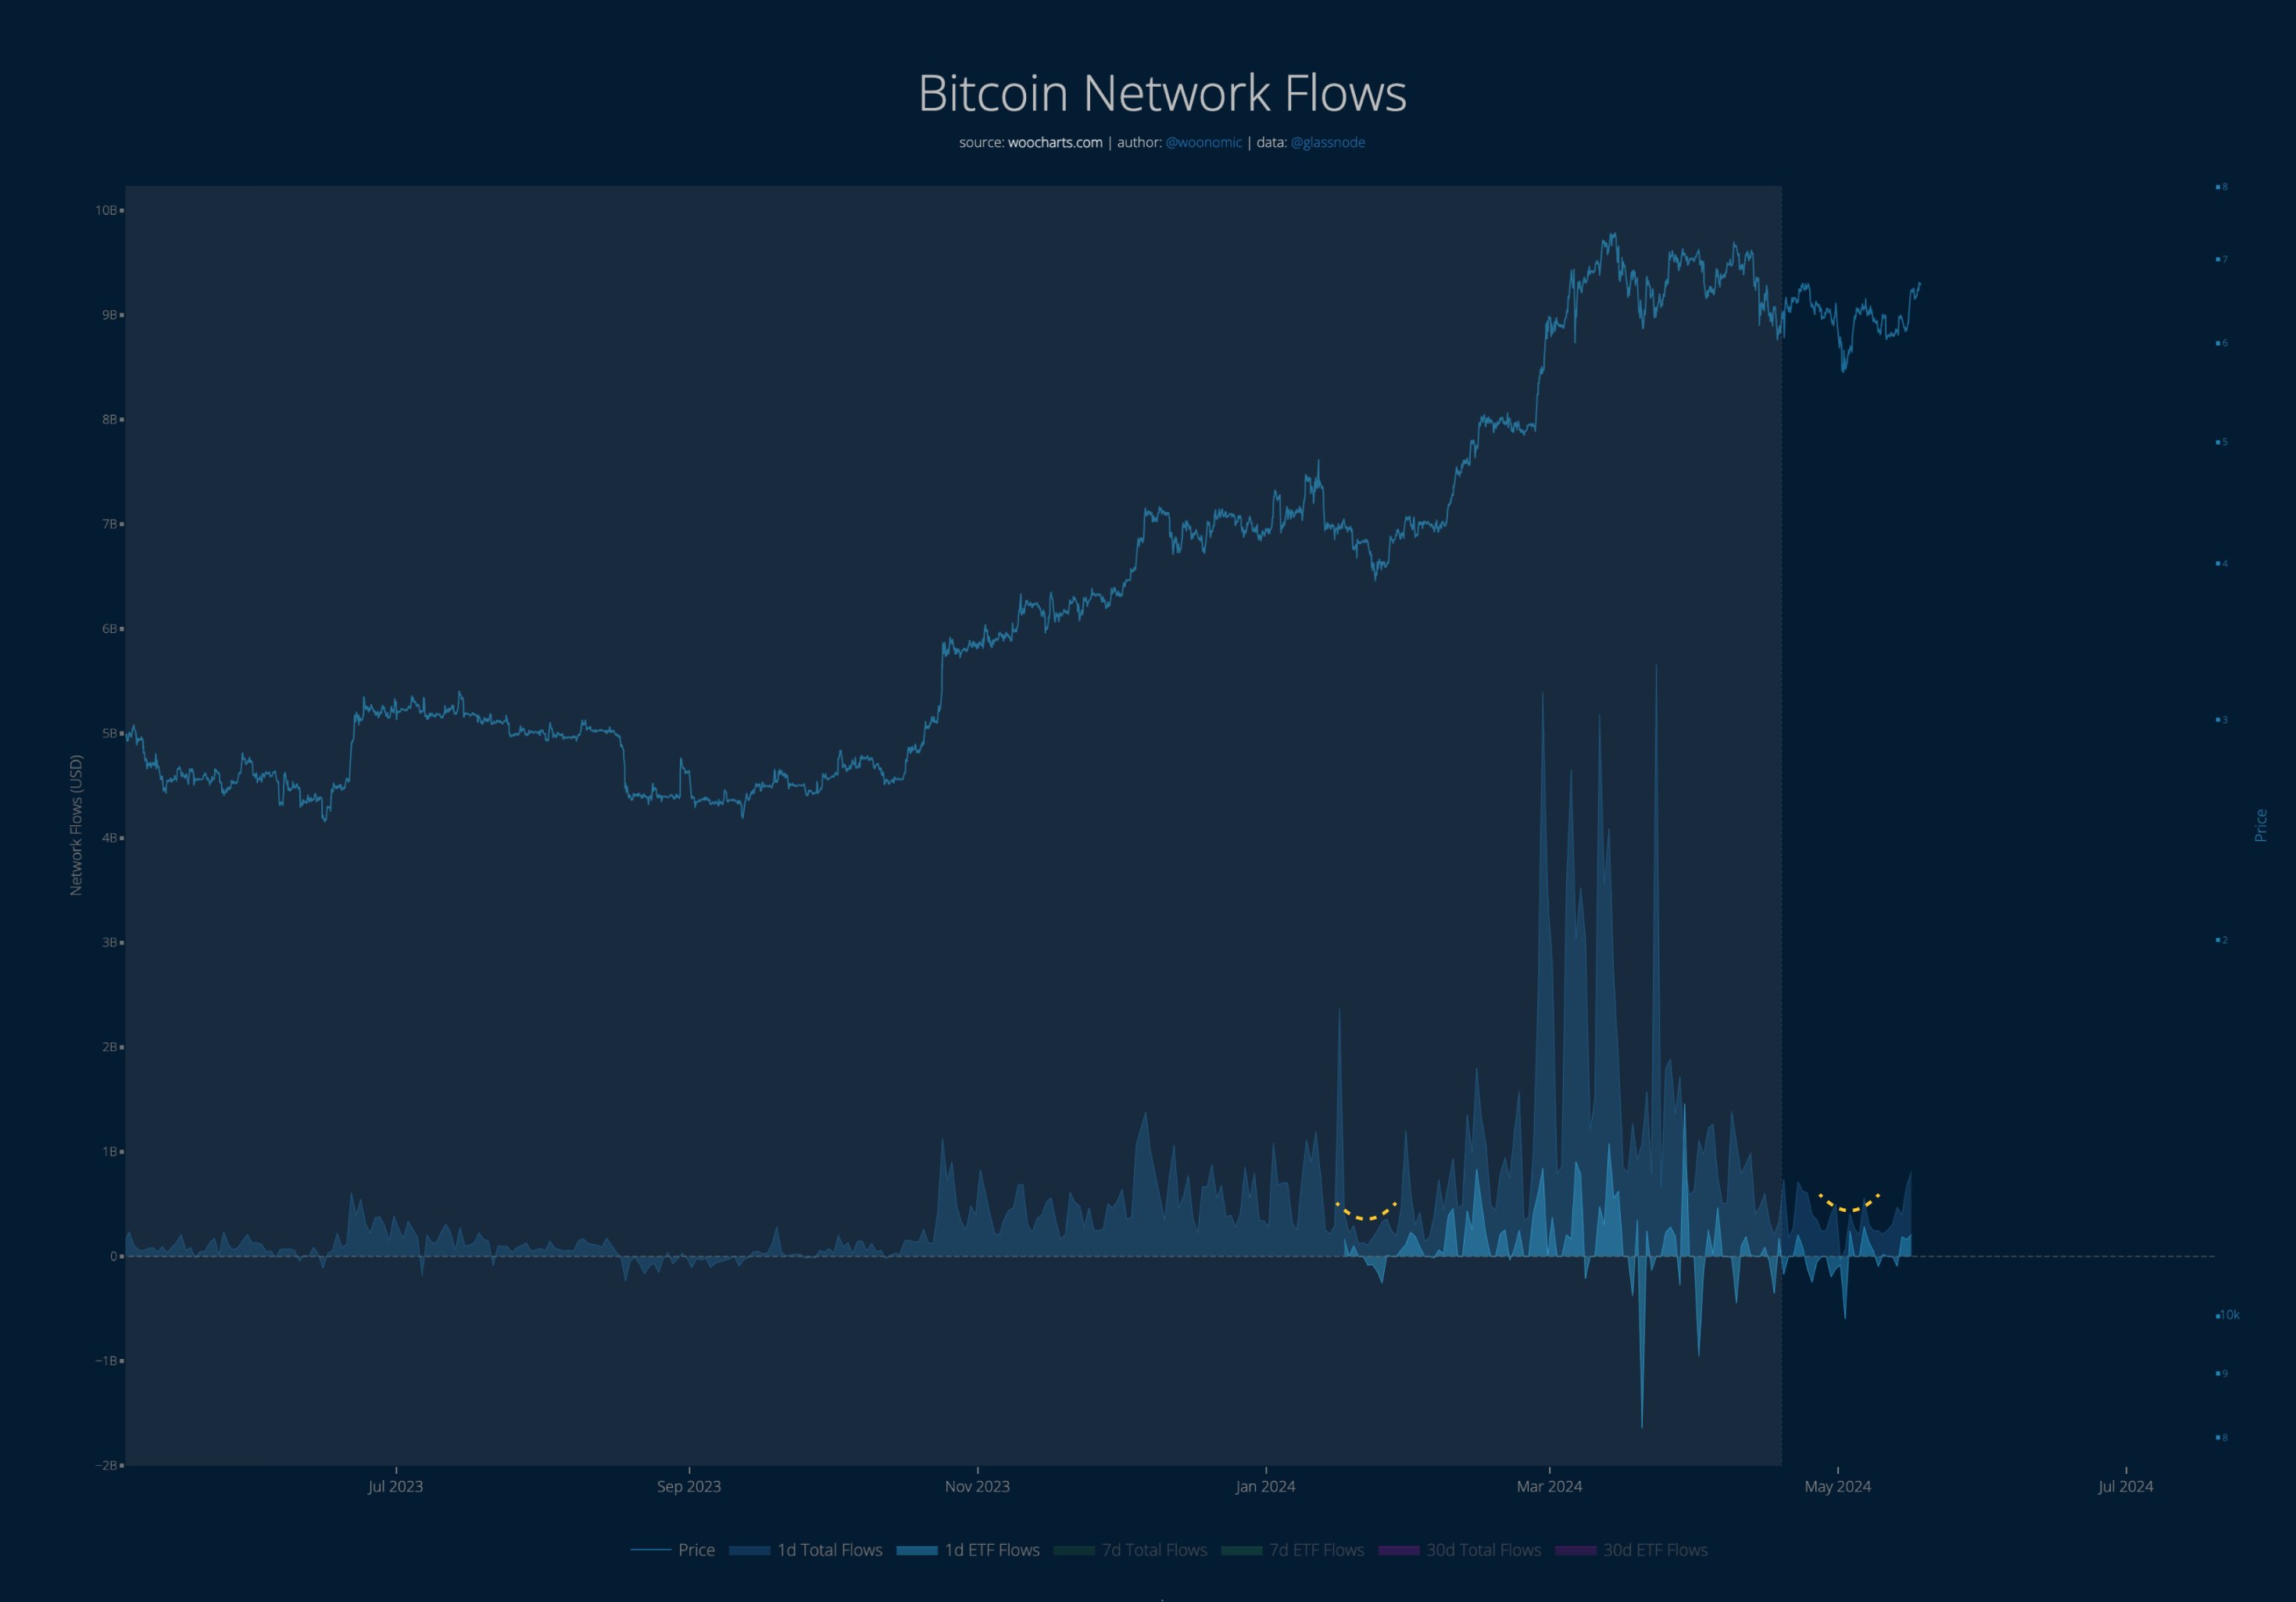
It would appear that two months after the profit-taking peaked, the appetite for harvesting gains has potentially finally disappeared among the investors. The analyst says this is a very healthy reset for the cryptocurrency, especially as the capital inflows have once again been picking up for the coin.
Looks like the indicator has gone through a turnaround recently | Source: @woonomic
From the chart, it’s apparent that the Bitcoin network flows had been following an overall downward trajectory earlier when the consolidation was taking place, but recently, capital injections into the coin have once again been on the rise.
Related Reading
This is a similar trend to what was observed earlier in the year during the crash following the approval of the spot exchange-traded funds (ETFs). The turnabout in capital inflows back then was what led into the rally that took the cryptocurrency to the current ATH.
BTC Price
Bitcoin had seen a pullback under $66,000 yesterday, raising worries that the recovery surge had already fizzled out. This drop only lasted briefly, though, as the coin has returned above $67,000 today.
The price of the asset appears to have been consolidating sideways over the last few days | Source: BTCUSD on TradingView
Featured image from Kanchanara on Unsplash.com, woocharts.com, chart from TradingView.com


