Following strong weekly double-digit gains from Bitcoin and a number of big-cap altcoins, the cryptocurrency market capitalization surpassed $1 trillion.
$1 Trillion Market Crossed Again
For the first time since June 13, a significant gain on Monday in both bitcoin and ether helped lift the market worth of cryptocurrencies back beyond the $1 trillion level.
The largest cryptocurrency has reached its highest prices since a selloff in mid-June brought the price of bitcoin down from $30,000 to as low as $18,000, rising 5% in the last 24 hours to $22,300.
During the late 2017 bull market surge for bitcoin, that same level served as a strong region of resistance, and in technical analysis, old resistance typically turns into new support (and vice versa).
Crypto market cap above $1 trillion threshold. Source: TradingView
For cryptocurrency investors, Monday’s profits should come as a relief after the preceding nine months have seen them endure a terrible bear market. As a result of the prolonged bear market in cryptocurrencies, $2 trillion in market value has been lost, and several crypto companies, including Celsius, Voyager Digital, and Three Arrows Capital, have gone bankrupt.
Despite analyst predictions that the Federal Reserve would increase interest rates by at least 75 basis points at the Federal Open Market Committee meeting on July 27, the traditional markets are mildly higher on the day that cryptocurrencies are generally in the black.
While traders may like the uptick in price on July 18, several analysts warn that it is merely a bear market pump.
Related Reading | Bitcoin Bearish Signal: Exchange Netflows Spike Up
Bitcoin Poised For Rebound
According to TradingView data, Bitcoin has made considerable gains over the past week. At the time of writing, BTC had risen by 16 percent from its most recent low of $18,907.
The most valuable cryptocurrency is currently bumping up into resistance at the 200-week moving average, which also happens to be the top of the trading range that BTC has been stuck in since the middle of June.
Over the past five weeks, attempts to break above this level have been repeatedly rejected, proving it to be a difficult nut to crack. It is yet unclear whether Bitcoin will be able to overcome this barrier and climb higher or if it will continue to fluctuate between $19,000 and $22,000.
$BTC battling that 200 Week MA again. Rejected 3 times in the last 5 weeks here.
Decision time imo.
We either have a fat breakout or fat breakdown. $ETH has been leading the market so far, along with many other altcoins. Breakouts occurring everywhere.
Can $BTC follow suit? pic.twitter.com/6Cz49po8CH
— Taner ⚡️ (@Taner_Crypto) July 18, 2022
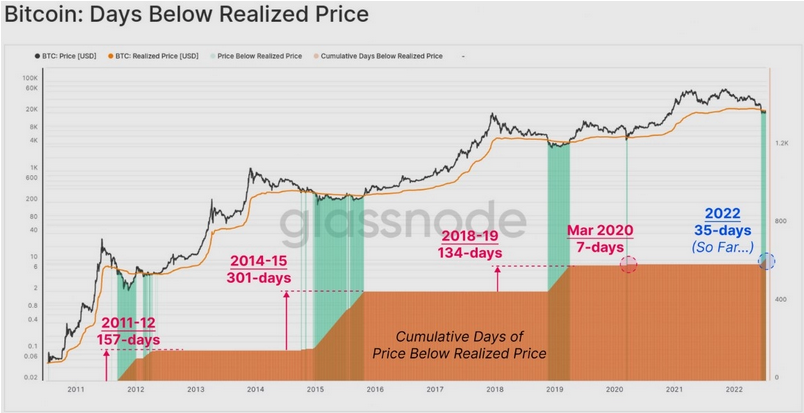
The major distinction between the present bear market and previous cycles, according to Glassnode’s most recent newsletter, is “duration” and many on-chain measures are now comparable to these historical drawdowns.
Realized price, which is calculated as the value of all Bitcoin divided by the quantity of BTC in circulation, has shown to be a good indicator of bear market bottoms.
Number of days Bitcoin price traded below the realized price. Source: Glassnode
With the exception of the flash crash in March 2020, which is depicted on the above chart, Bitcoin has consistently traded below its realized price for a protracted period of time throughout bear markets.
Glassnode explained:
“The average time spent below the Realized Price is 197-days, compared to the current market with just 35-days on the clock.”
Related Reading | Bitcoin Breaks Above Realized Price Again, Bottom Finally In?
Featured image from Getty Images, charts from TradingView.com


