
Bitcoin (BTC) stayed volatile at the March 4 Wall Street open as weak crypto markets weighed the impact of US trade tariffs.
BTC/USD 1-hour chart. Source: Cointelegraph/TradingView
Bitcoin edges closer to multimonth lows
Data from Cointelegraph Markets Pro and TradingView showed new local lows of $82,037 for BTC/USD on Bitstamp.
A rebound then took the pair, still down over $10,000 versus the prior day’s high, to near $85,000.
Bitcoin and altcoins felt the heat thanks to US tariffs against Mexico and Canada going into effect, while plans for a US strategic crypto reserve remained elusive ahead of a dedicated White House Crypto Summit event on March 7.
“This sell-off was exacerbated by Trump’s renewed push for tariffs on Canada, Mexico, and China, reinforcing investor concerns over escalating trade tensions,” trading firm QCP Capital wrote in its latest analysis sent to Telegram channel subscribers.
QCP noted that stocks were also struggling in the face of tariff pressures, something likely on the radar for President Donald Trump.
“This downturn could intensify pressure on Trump, especially after the strong support and donations he received from the crypto community during his campaign,” it continued.
“Even the SEC’s latest move — pausing and dismissing enforcement cases against crypto firms — failed to stem the sell-off, underscoring broader risk aversion in the market. After a month of subdued cross-asset volatility, market anxiety has resurfaced with the prospect of tit-for-tat tariffs dampening global growth sentiment.”
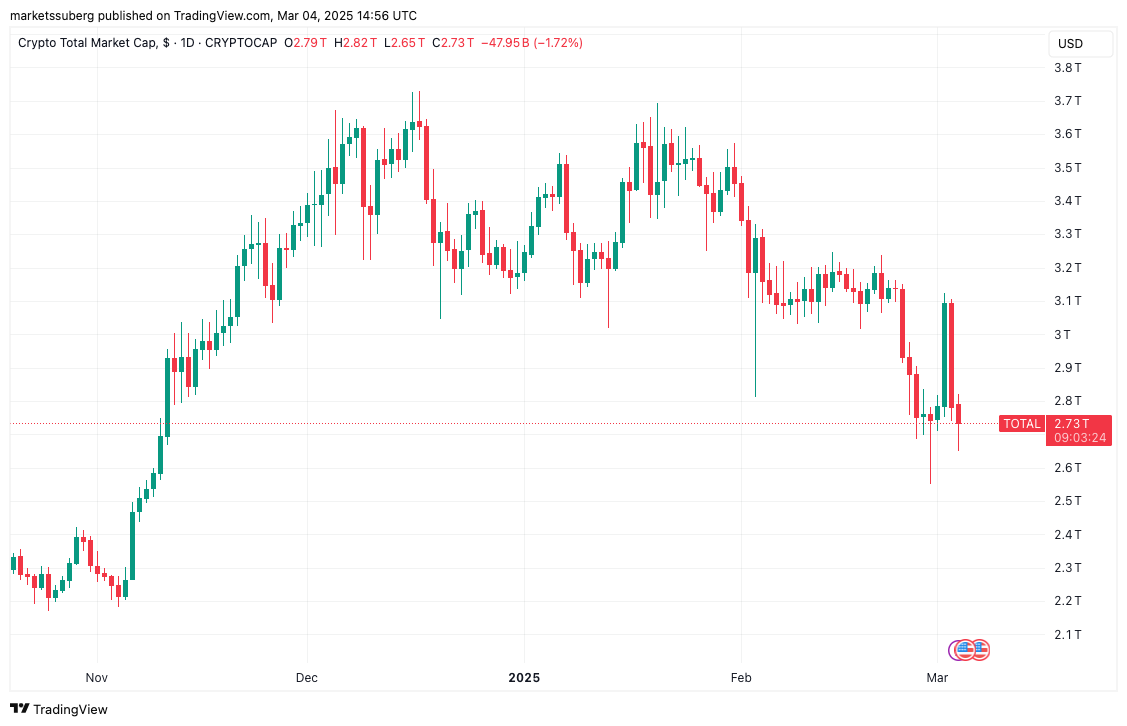
Total crypto market cap 1-day chart. Source: Cointelegraph/TradingView
Trading firm Mosaic Asset meanwhile took an optimistic view of how risk-asset performance could evolve in the short term.
“Bearish investor sentiment and oversold breadth are conditions that can help see a rally unfold,” it argued in the latest edition of its regular newsletter, “The Market Mosaic,” on March 2.
“Near-term, seasonality and cycle trends for the S&P 500 can become a tailwind as well. The last two week’s of February are historically among the most negative for the S&P 500, but March is the best month during the first half of the calendar year for the past 15 years on average.”
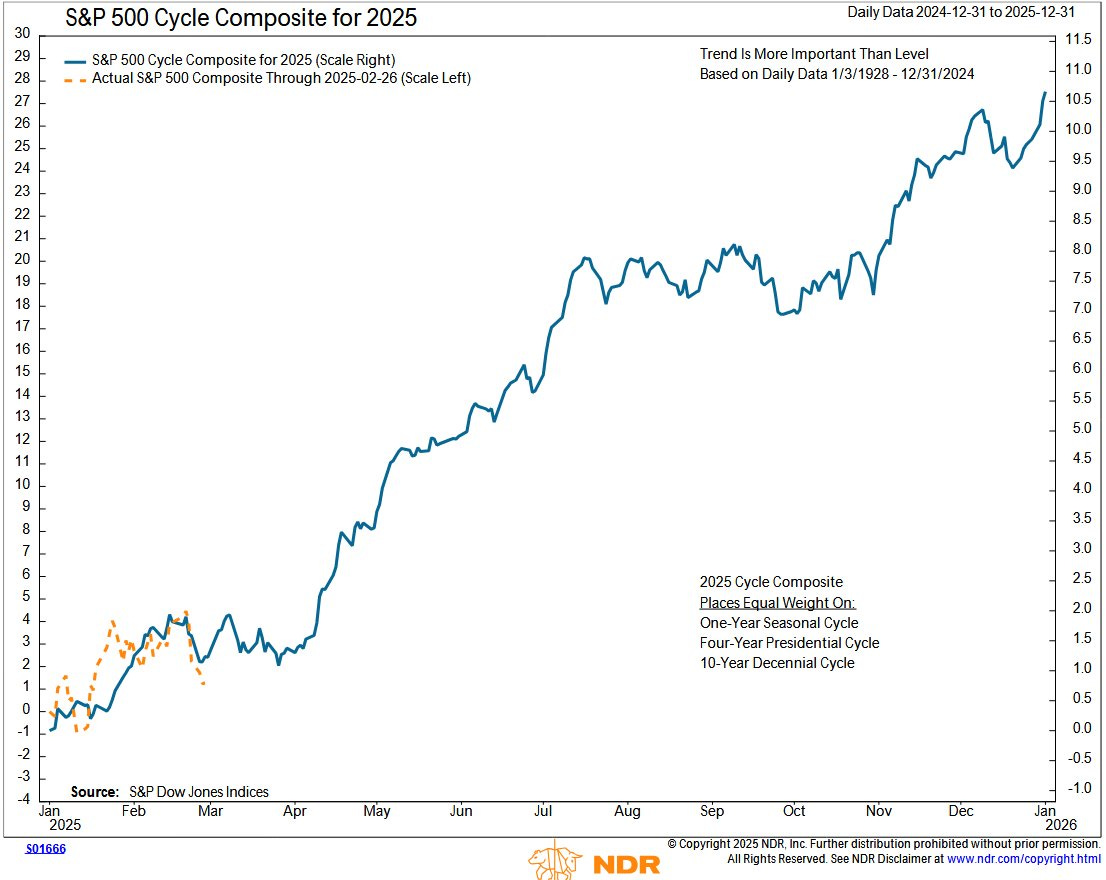
S&P 500 cycle comparison. Source: Mosaic Asset
Hope remains for sustained BTC price comeback
That perspective chimes with existing expectations for Bitcoin.
Related: Bitcoin no longer ‘safe haven’ as $82K BTC price dive leaves gold on top
As Cointelegraph reported, Julien Bittel, head of macro research at Global Macro Investor, last week forecast a March recovery thanks to shifting macroeconomic conditions.
“Everything happening in markets right now, especially in crypto, is a direct consequence of the tightening of financial conditions in Q4 last year,” he told X followers.
The US dollar index (DXY) meanwhile hit 12-week lows on the day before seeing a modest relief bounce of its own.
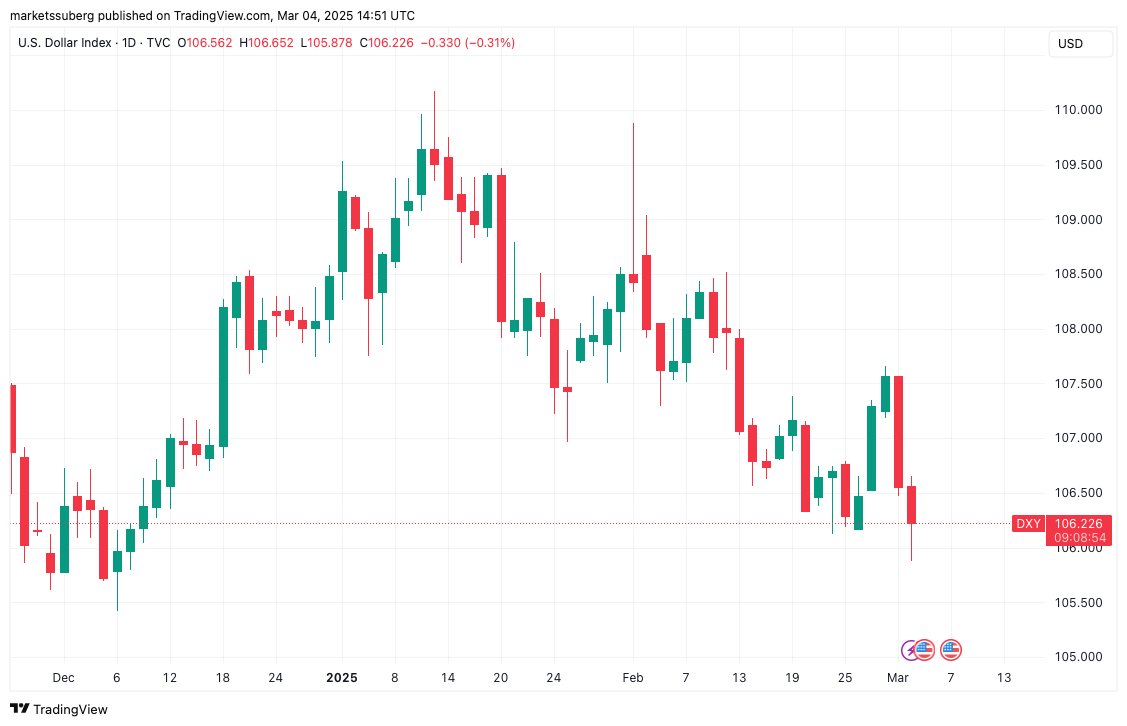
US dollar index (DXY) 1-day chart. Source: Cointelegraph/TradingView
This article does not contain investment advice or recommendations. Every investment and trading move involves risk, and readers should conduct their own research when making a decision.


