Crypto analyst Jesse Olson has highlighted the second consecutive Heikin Ashi signal on the Bitcoin (BTC) weekly chart. This comes despite Bitcoin’s recent rise to as high as $58,000, which suggests that a bullish reversal might be on the horizon.
What The Heikin Ashi Signal Means For Bitcoin
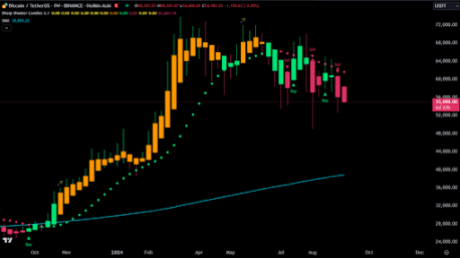
While highlighting the second consecutive Heikin Ashi on Bitcoin‘s weekly chart, Olson also noted that there was no wick to the upside, which suggests that the downside trend is likely to continue. The crypto analyst had also previously explained how the absence of a wick to the upside signals a strength in momentum to the downside.
Related Reading
Based on Olson’s accompanying chart, Bitcoin could suffer further downward pressure and drop to as low as $40,000. This bearish analysis comes amid Bitcoin’s recovery as its price rose to $58,000 in the last 24 hours. Although it remains to be seen whether it is a relief bounce or a bullish reversal, Olson’s analysis suggests that it is more likely a relief bounce.
However, crypto analyst Daan Crypto has suggested that Bitcoin needs to successfully break above $60,000 to achieve a bullish reversal and aim for new highs in this market cycle. Meanwhile, contrary to Olson’s bearish analysis, crypto analyst Mikybull Crypto has provided a more bullish outlook for Bitcoin.
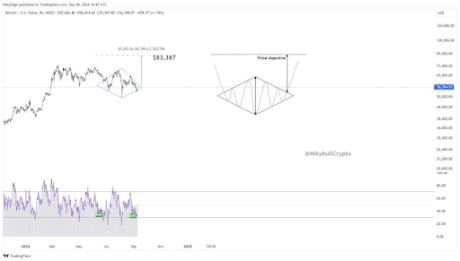
In an X (formerly Twitter) post, the crypto analyst stated that Bitcoin has completed the bullish diamond formation. In line with this, Mikybull Crypto remarked that he believes the bottom is in for Bitcoin if the bull market is still on.
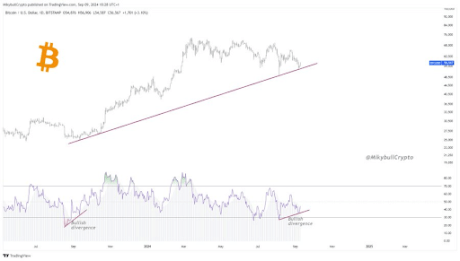
In another X post, Mikybull Crypto highlighted a bullish divergence recently formed on Bitcoin’s chart, similar to one in September 2023. Following the bullish divergence in September 2023, BTC experienced a significant rally, which ultimately paved the way for reaching a new all-time high (ATH) in March earlier this year. As such, something similar could happen again as Bitcoin tries to reach new highs.
BTC’s Price Rally Could Begin After September
Considering Bitcoin’s historical bearish trend in September, the crypto community is optimistic that BTC could begin its long-awaited price rally once this month is over. In a recent analysis, crypto analyst Rekt Capital explained why the flagship crypto would likely record massive gains in October.
Related Reading
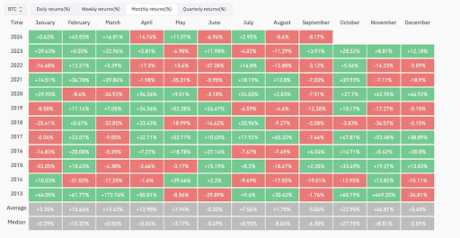
The crypto analyst noted that Bitcoin’s only monthly losses in October were in 2014 and 2018, when it recorded monthly losses of -12.95% and -3.83%, respectively. He added that those were bear markets. However, Bitcoin is in a halving year, historically ushering in the bull market. As such, BTC could enjoy a bullish ride in October and even to the end of the year, especially with the upcoming US presidential elections in November.
At the time of writing, Bitcoin is trading at around $56,600, up over 3% in the last 24 hours, according to data from CoinMarketCap.

Featured image created with Dall.E, chart from Tradingview.com


