Data shows the Bitcoin market sentiment has worsened recently and is approaching extreme fear territory.
Bitcoin Fear & Greed Index Has Plunged Inside The Fear Region Recently
The “fear and greed index” is a Bitcoin indicator that tells us about the general sentiment among the investors in the Bitcoin and broader cryptocurrency market. This metric uses a numeric scale from zero to a hundred to represent this sentiment.
When the index has a value greater than 54, the investors share greed. On the other hand, values under 46 imply the presence of fear in the market. The in-between region naturally suggests that the majority mentality is neutral currently.
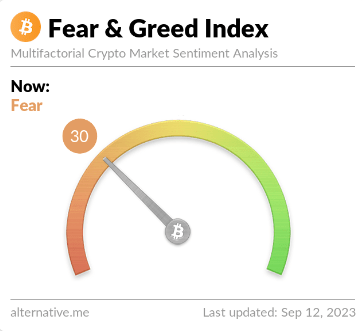
Here is what the Bitcoin fear and greed index looks like right now:
The value of the index appears to be 30 at the moment | Source: Alternative
As displayed above, the Bitcoin fear and greed index currently has a value of 30, meaning that most investors in the sector share a mentality of fear.
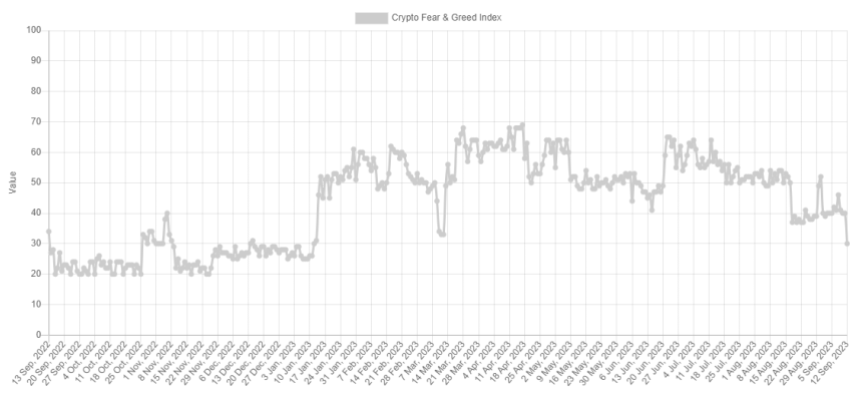
Just yesterday, the indicator had a value of 40, implying that the sentiment has worsened quite a bit during the past day.
Looks like the metric's value has sharply declined | Source: Alternative
Besides the three core sentiments already discussed, there are also “extreme fear” and “extreme greed.” These two regions of the indicator have been pretty significant historically for the cryptocurrency.
The reason is that extreme fear occurs at and under 25 when the major bottoms have formed for the asset’s price. Similarly, the tops have occurred in extreme greed (at and above 75).
Bitcoin has generally tended to go against what most investors expect. The extreme regions are when this expectation is the strongest, hence why a reversal occurred.
A trading technique called “contrarian investing” exploits this apparent pattern. Warren Buffet’s famous quote says, “be fearful when others are greedy, and greedy when others are fearful.”
The current value of the index (30) is quite close to the extreme fear region, which means that if sentiment worsens further in the coming days, it might drop into this territory. Naturally, if such a drop happens, a contrarian investor might take it as a signal to buy the cryptocurrency.
Interestingly, if Bitcoin bottoms out in the coming weeks and sets itself up for a reversal, it would align with the historical Halloween Effect. According to this effect, BTC and other assets usually perform the best between 31 October and 1 May.
Those who practice the “sell in May and go away” strategy come back this season to buy back into the asset. It remains to be seen how the Bitcoin sentiment will develop in the coming month and if the Halloween Effect will play any role.
BTC Price
At the time of writing, Bitcoin is trading at around $26,200, up 1% during the past week.
BTC has enjoyed some rise during the past 24 hours | Source: BTCUSD on TradingView
Featured image from Kanchanara on Unsplash.com, charts from TradingView.com, Alternative.me


