
Bitcoin grabbed downside liquidity as oil-supply pressure sent BTC price action below $66,500 to its lowest levels since March 9.
Bitcoin (BTC) neared three-week lows into Friday’s Wall Street open amid reports of Iran closing the Strait of Hormuz oil route.
Key points:
-
Bitcoin reacts badly to fresh oil-supply threats ahead of Friday’s Wall Street open.
-
BTC price action hunts bid liquidity, continuing a week of low-time frame liquidity grabs.
-
Another bear flag threatens to send the market below $50,000, analysis says.
Bitcoin eyes range lows into monthly close
Data from TradingView showed BTC price action slipping below $66,500 ahead of the Wall Street open.
US stocks futures trended down and US WTI crude oil eyed $97 per barrel as geopolitical tensions refused to let up.
Data from CoinGlass showed BTC/USD eating into a ladder of bid liquidity extending down to $65,000, with a wall of asks keeping price pinned below the $70,000 mark.
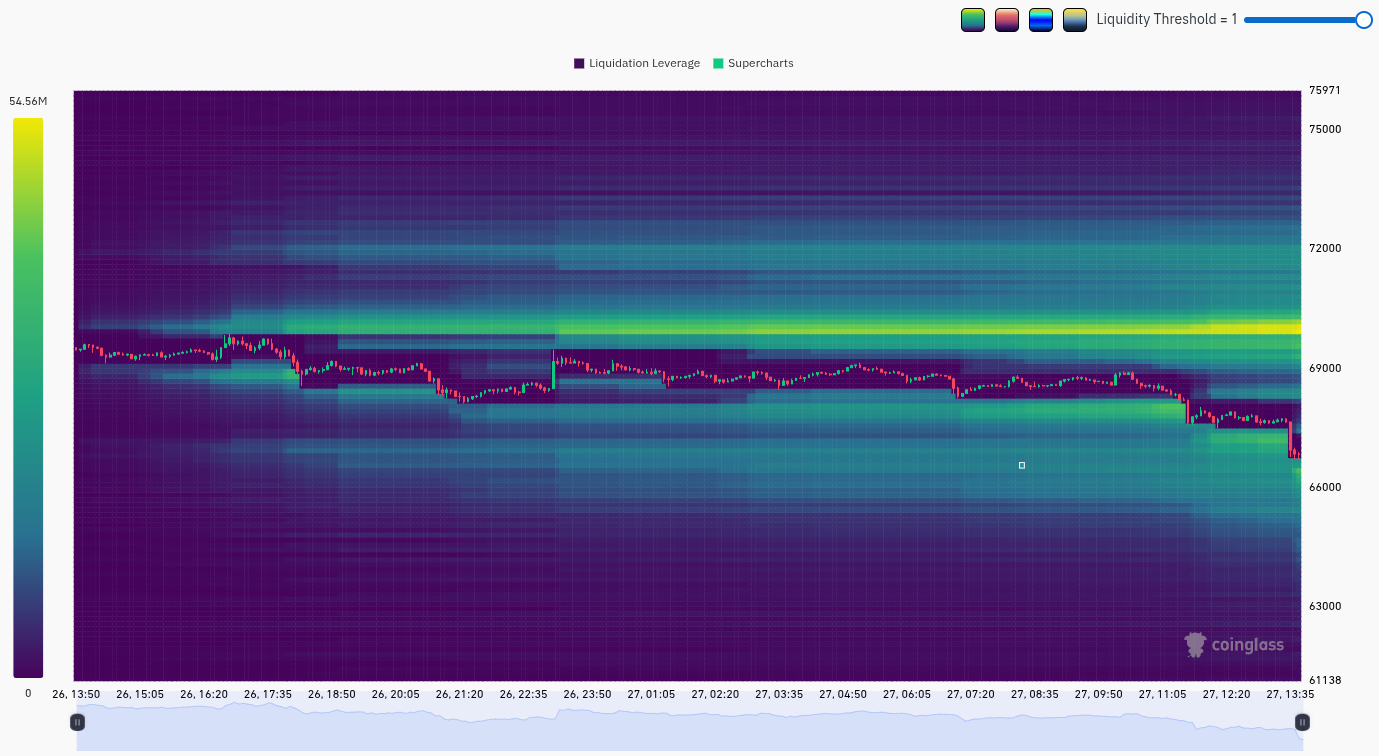
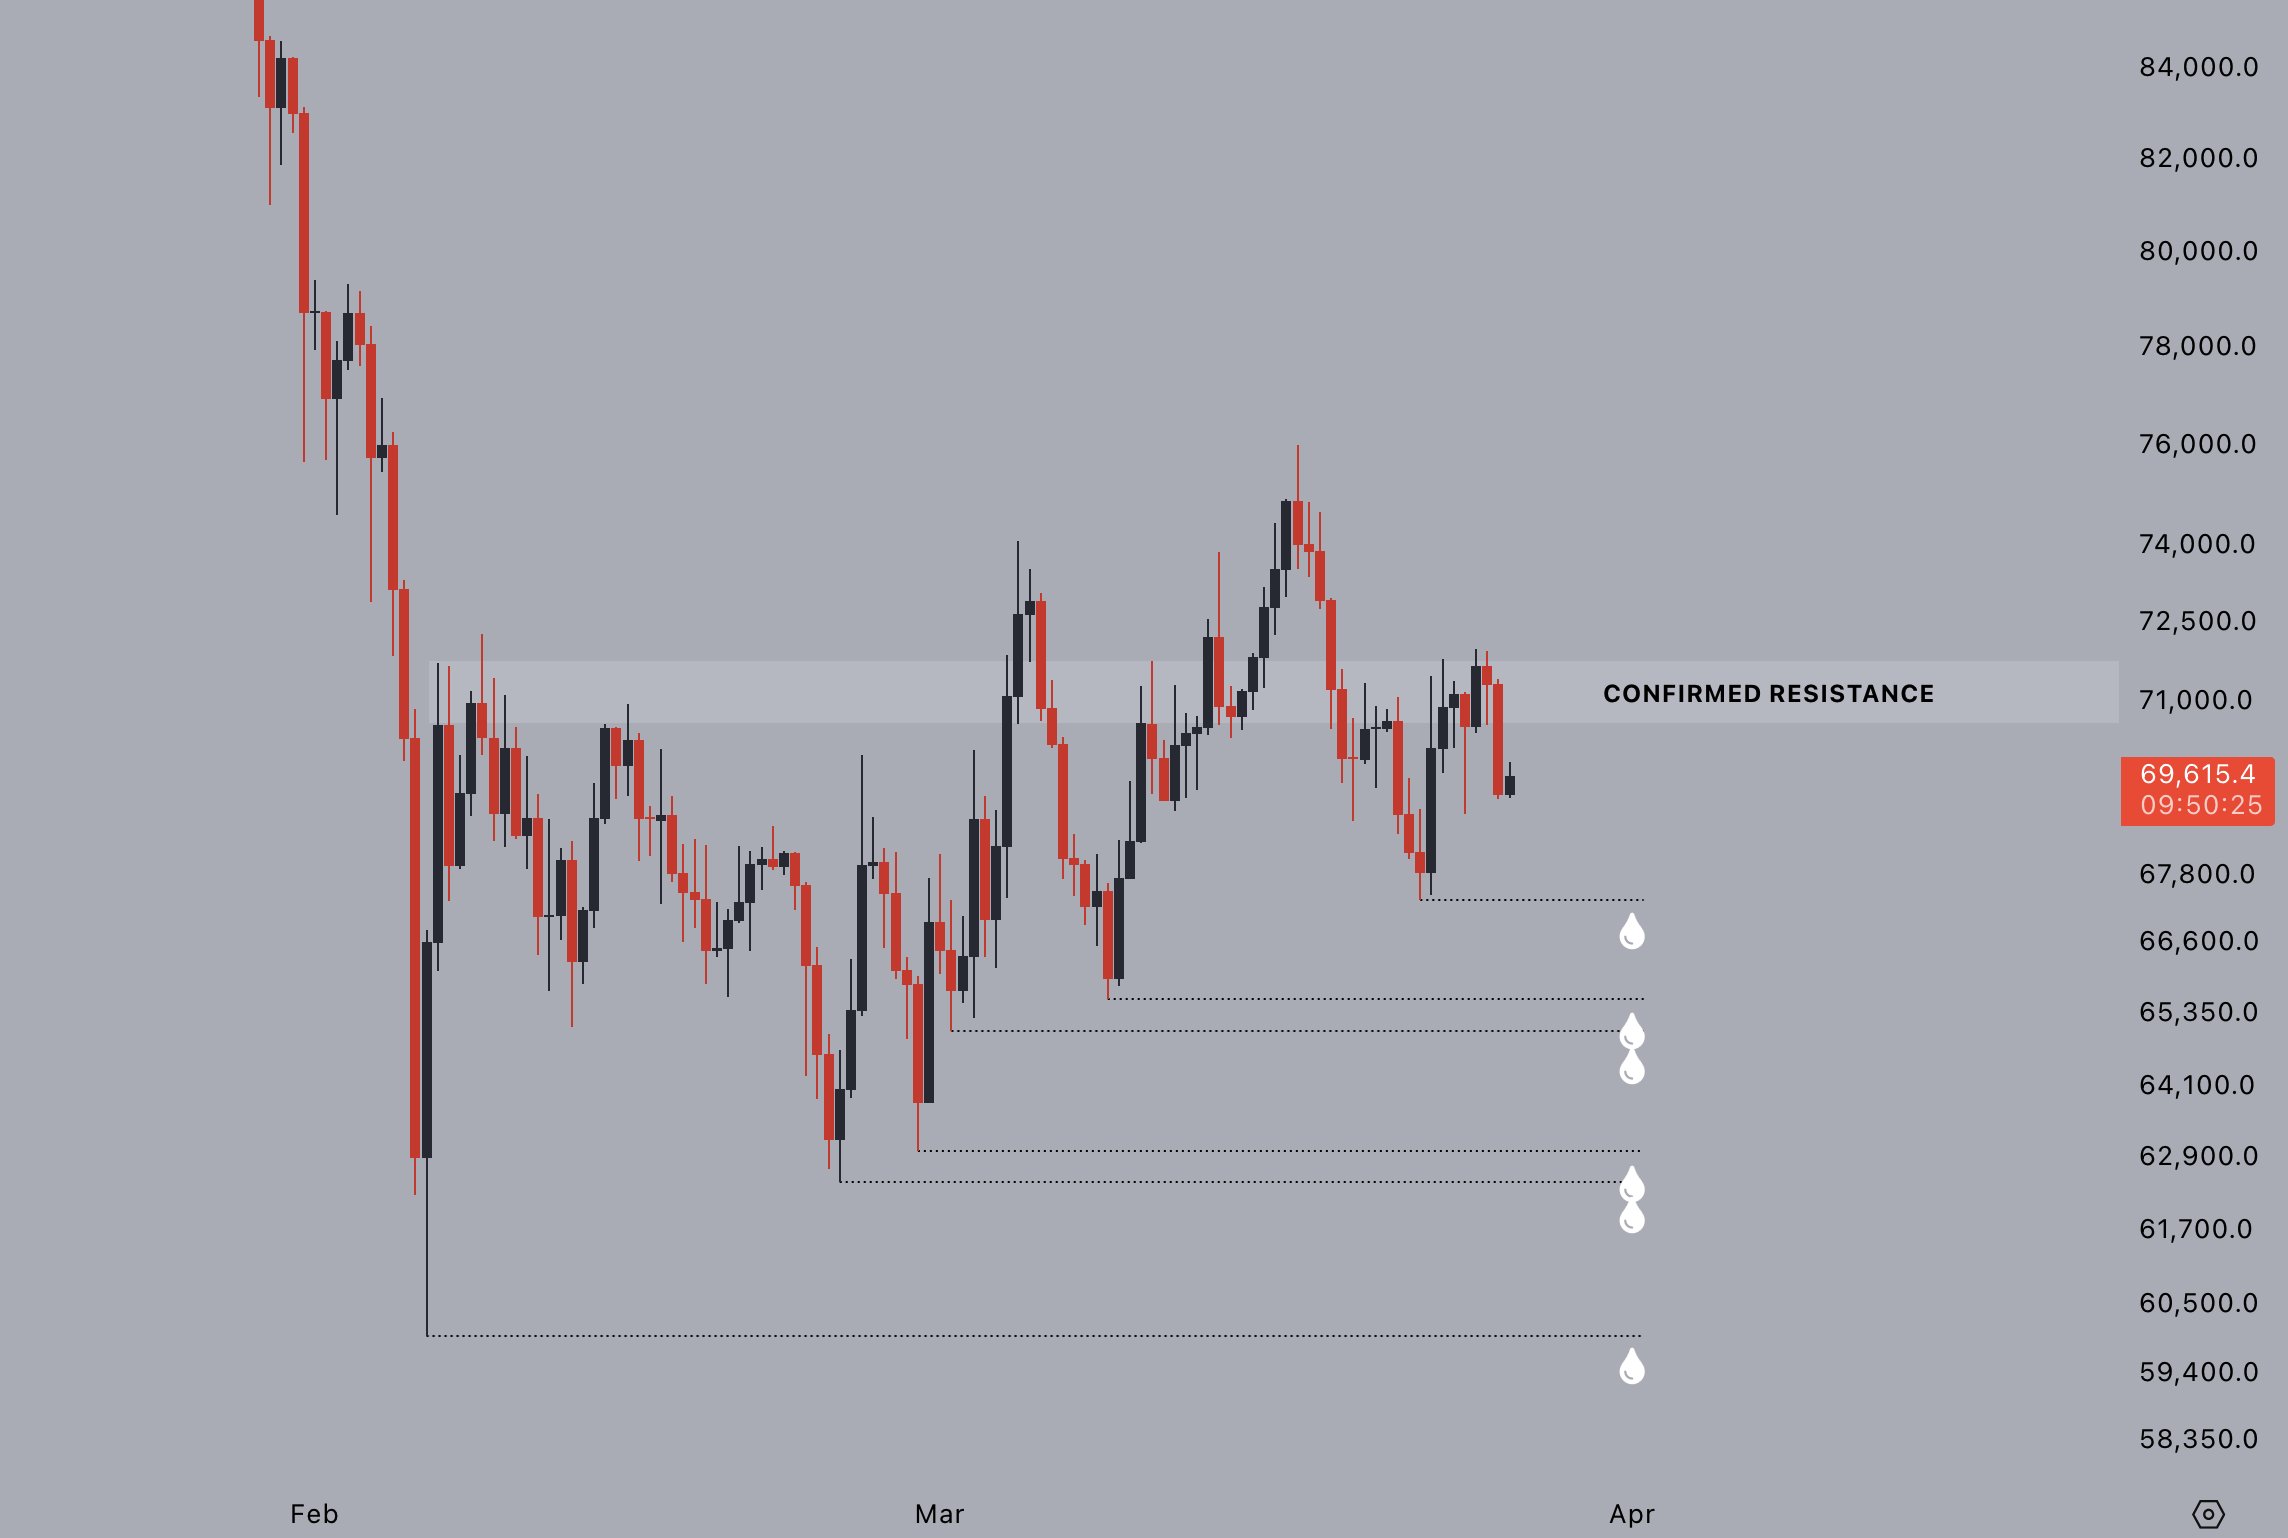
“$70-71k confirmed as resistance again,” trader Jelle wrote in analysis on X the day prior.
“Still a bunch of liquidity built up below, generally not what you see at market bottoms. Expecting that liquidity to be taken out; sooner or later.”
The latest market moves continued a theme of liquidity grabs seen throughout the week.
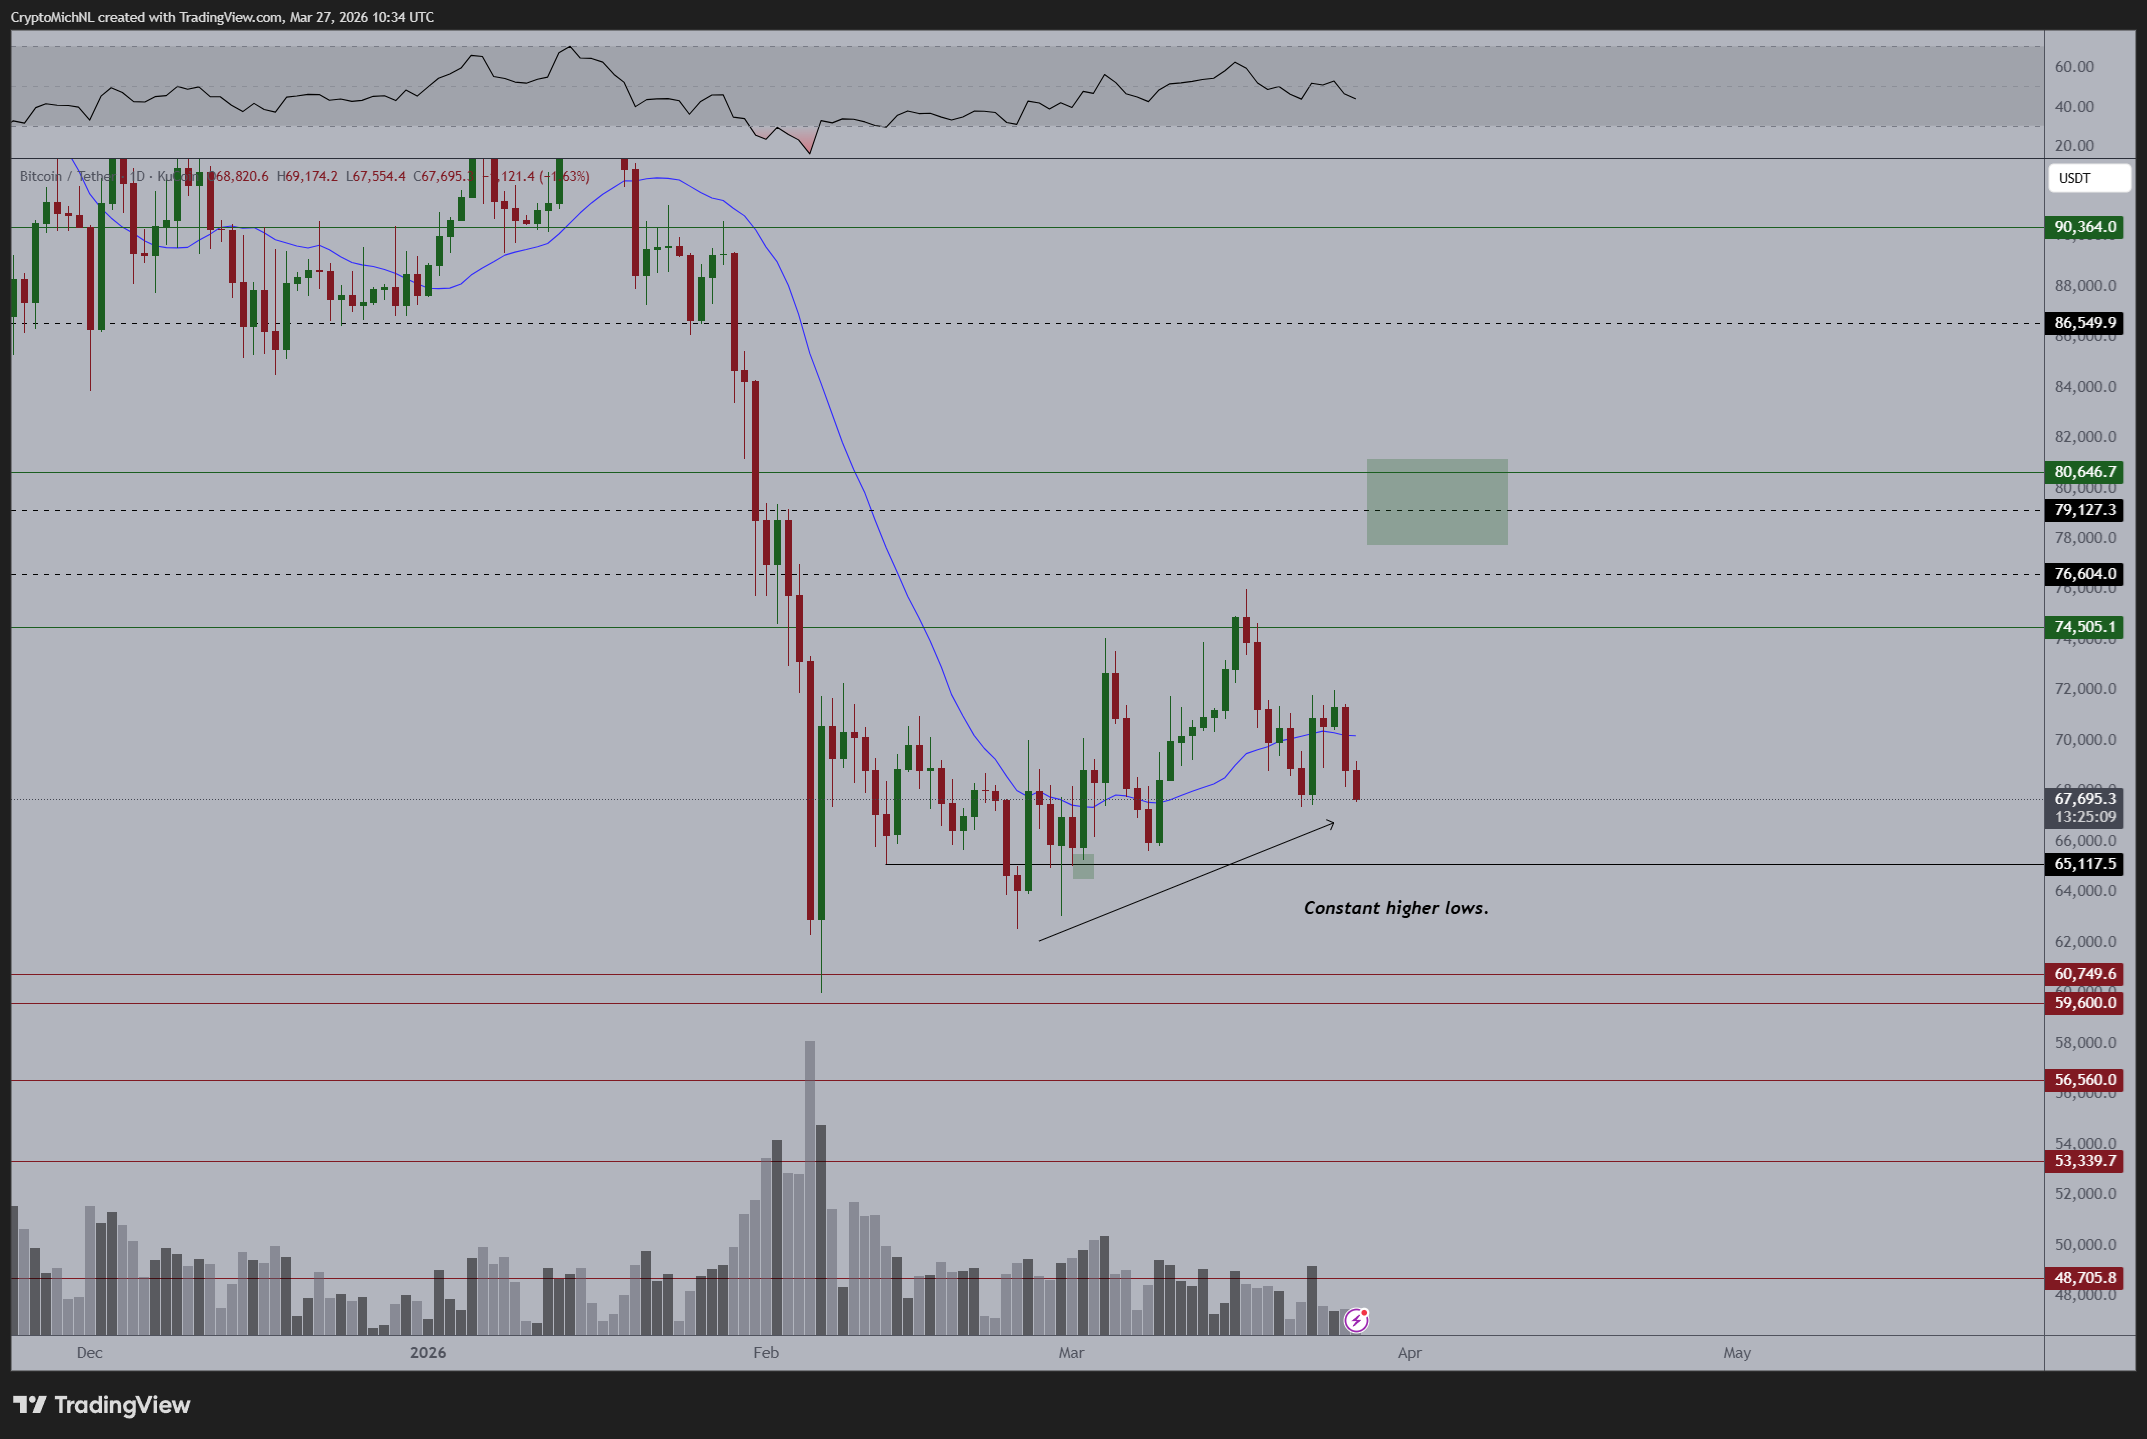
Continuing, crypto trader Michaël Van de Poppe said that he would not be “surprised” about further BTC price weakness into the March monthly candle close.
“Especially given that we’re currently anticipating a potential sweep of the lows,” he told X followers on the day.
“In that case, I remain to be interested to be buying in the lower $60K regions.”
BTC price gets $41,000 “measured target”
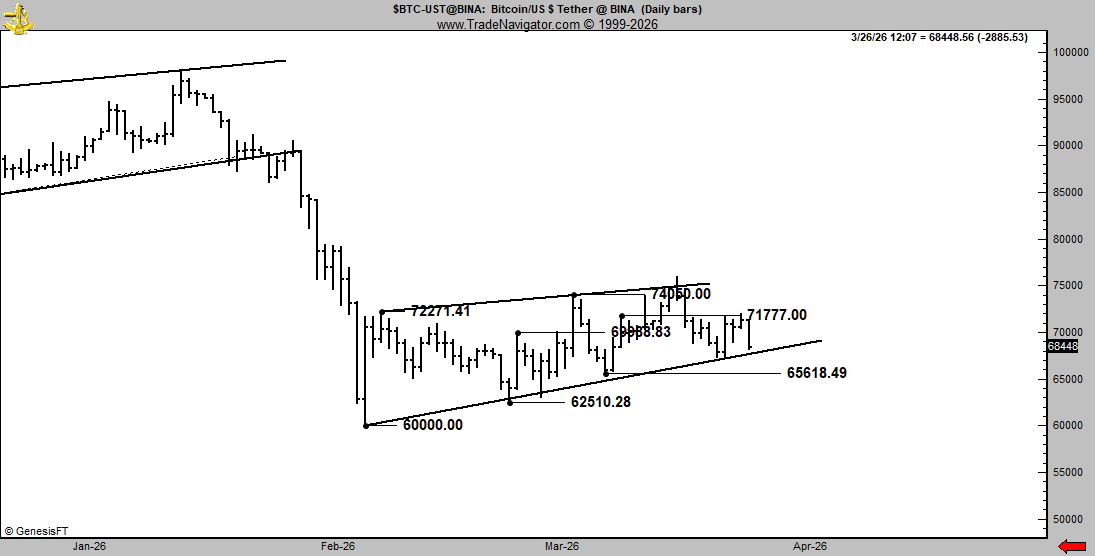
On longer time frames, market participants focused on a potential bearish support breakdown from Bitcoin’s second bear flag construction of 2026.
Related: US recession odds near 50%: Can Bitcoin copy 2020 comeback gains?
Previously occurring in January, the current bear flag has produced targets below $50,000.
“Bitcoin setting up for a rising wedge sell signal,” veteran trader Peter Brandt warned on Wednesday, joining those calls.
In his own X update, trader and educator Aaron Dishner continued the bearish tone around the flag structure.
“BTC is doing exactly what the bear flag setup called for. Price broke below the cloud yesterday on the daily, and today opened below it – currently down just 0.32% but that’s not a recovery, that’s hesitation,” he commented.
“The measured target from the January 14th high to the February 6th low, applied to the current flag structure, puts the downside at $41K.”
This article does not contain investment advice or recommendations. Every investment and trading move involves risk, and readers should conduct their own research when making a decision. While we strive to provide accurate and timely information, Cointelegraph does not guarantee the accuracy, completeness, or reliability of any information in this article. This article may contain forward-looking statements that are subject to risks and uncertainties. Cointelegraph will not be liable for any loss or damage arising from your reliance on this information.

