
Bitcoin (BTC) headed lower into the April 17 Wall Street open as downside began liquidating longs.
Bitcoin’s price tipped for a break below $29,000
Data from Cointelegraph Markets Pro and TradingView showed BTC/USD wicking to $29,247 on Bitstamp — its lowest in a week.
Gains for Asian stocks failed to rescue the losses on the day, these beginning immediately after the April 16 weekly close.
Traders, many of whom had predicted a retest of $30,000 support, were unsurprised, with many hoping that the event would form a “buy-the-dip” opportunity before Bitcoin moved higher.
Popular trader Crypto Ed said that BTC/USD had “swept the lows,” while others focused on the area around $28,500 as a potential bottom zone.
Some level of support at 29.2 may gave some reaction but 28.6 will be the retest of a major level and a significant one at that. https://t.co/LASJfYoZmb pic.twitter.com/sdLrP51082
— XO (@Trader_XO) April 17, 2023
“BTC bid ladders down to $28.5k want to get filled, but it’s worth noting that the phrase, ‘There are no straight lines in trading’ applies in both directions,” monitoring resource Material Indicators summarized, noting shifts in liquidity on the Binance order book.
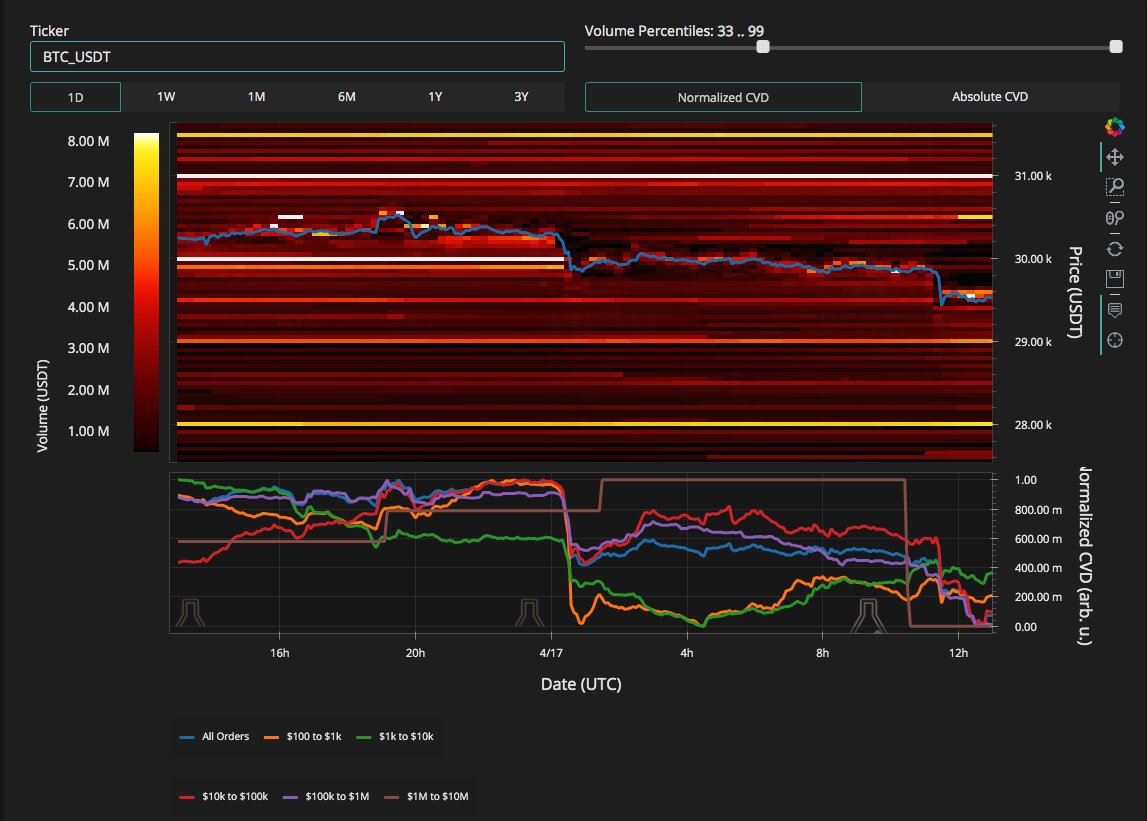
Material Indicators co-founder Keith Alan eyed the 21-day moving average at $28,860 as short-term support.
Should this fail to hold, he said, it might spark a retest of the 200-week moving average at $25,860 — around 12% lower than the current spot price and 16.5% below the recent local high.
#Bitcoin starting the week with some downside volatility. If Technical Support at the 21-Day Moving Average doesn’t hold, I expect a long awaited retest of the 200 Week Moving Average. #NFA pic.twitter.com/jPksE4sAIh
— Keith Alan (@KAProductions) April 17, 2023
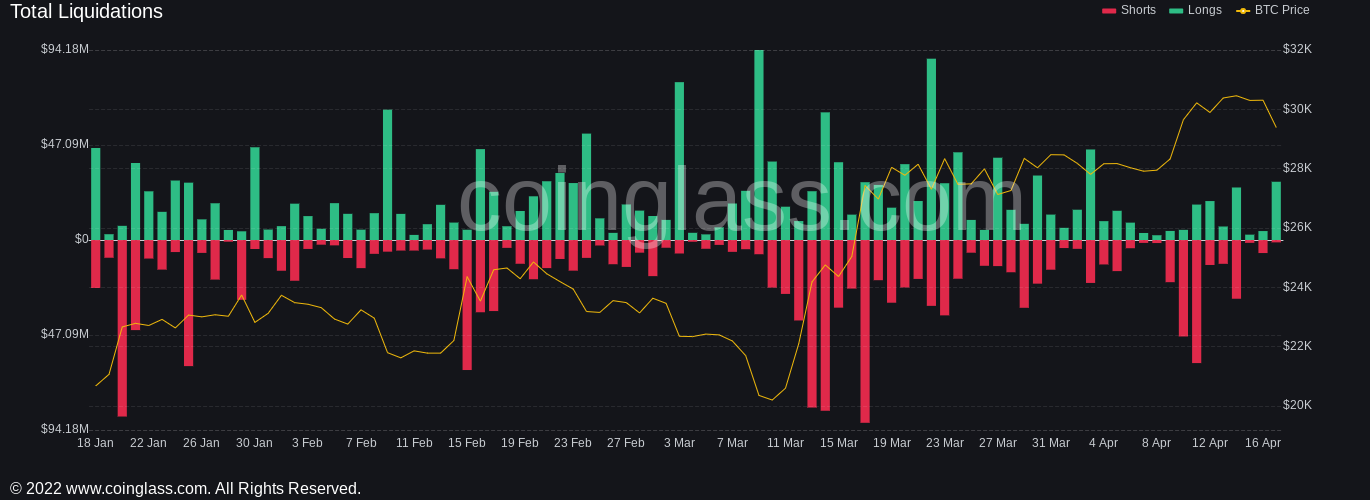
Despite the broad optimism, Bitcoin bulls were feeling the pain at the time of writing, with long liquidations for April 17 totaling nearly $29 million, according to data from Coinglass. Cross-crypto liquidations stood at nearly $67 million.
“Key level here for Bitcoin,” financial commentator Tedtalksmacro added.
“Reclaiming $29.7k is key for new highs… you wanted dip, this is the dip!”
U.S. dollar seeks “telegraphed” double bottom
United States equities saw a muted reaction at the open, with the S&P 500 and Nasdaq Composite Index both up by around 0.1%.
Related: BTC price heading under $30K? 5 things to know in Bitcoin this week
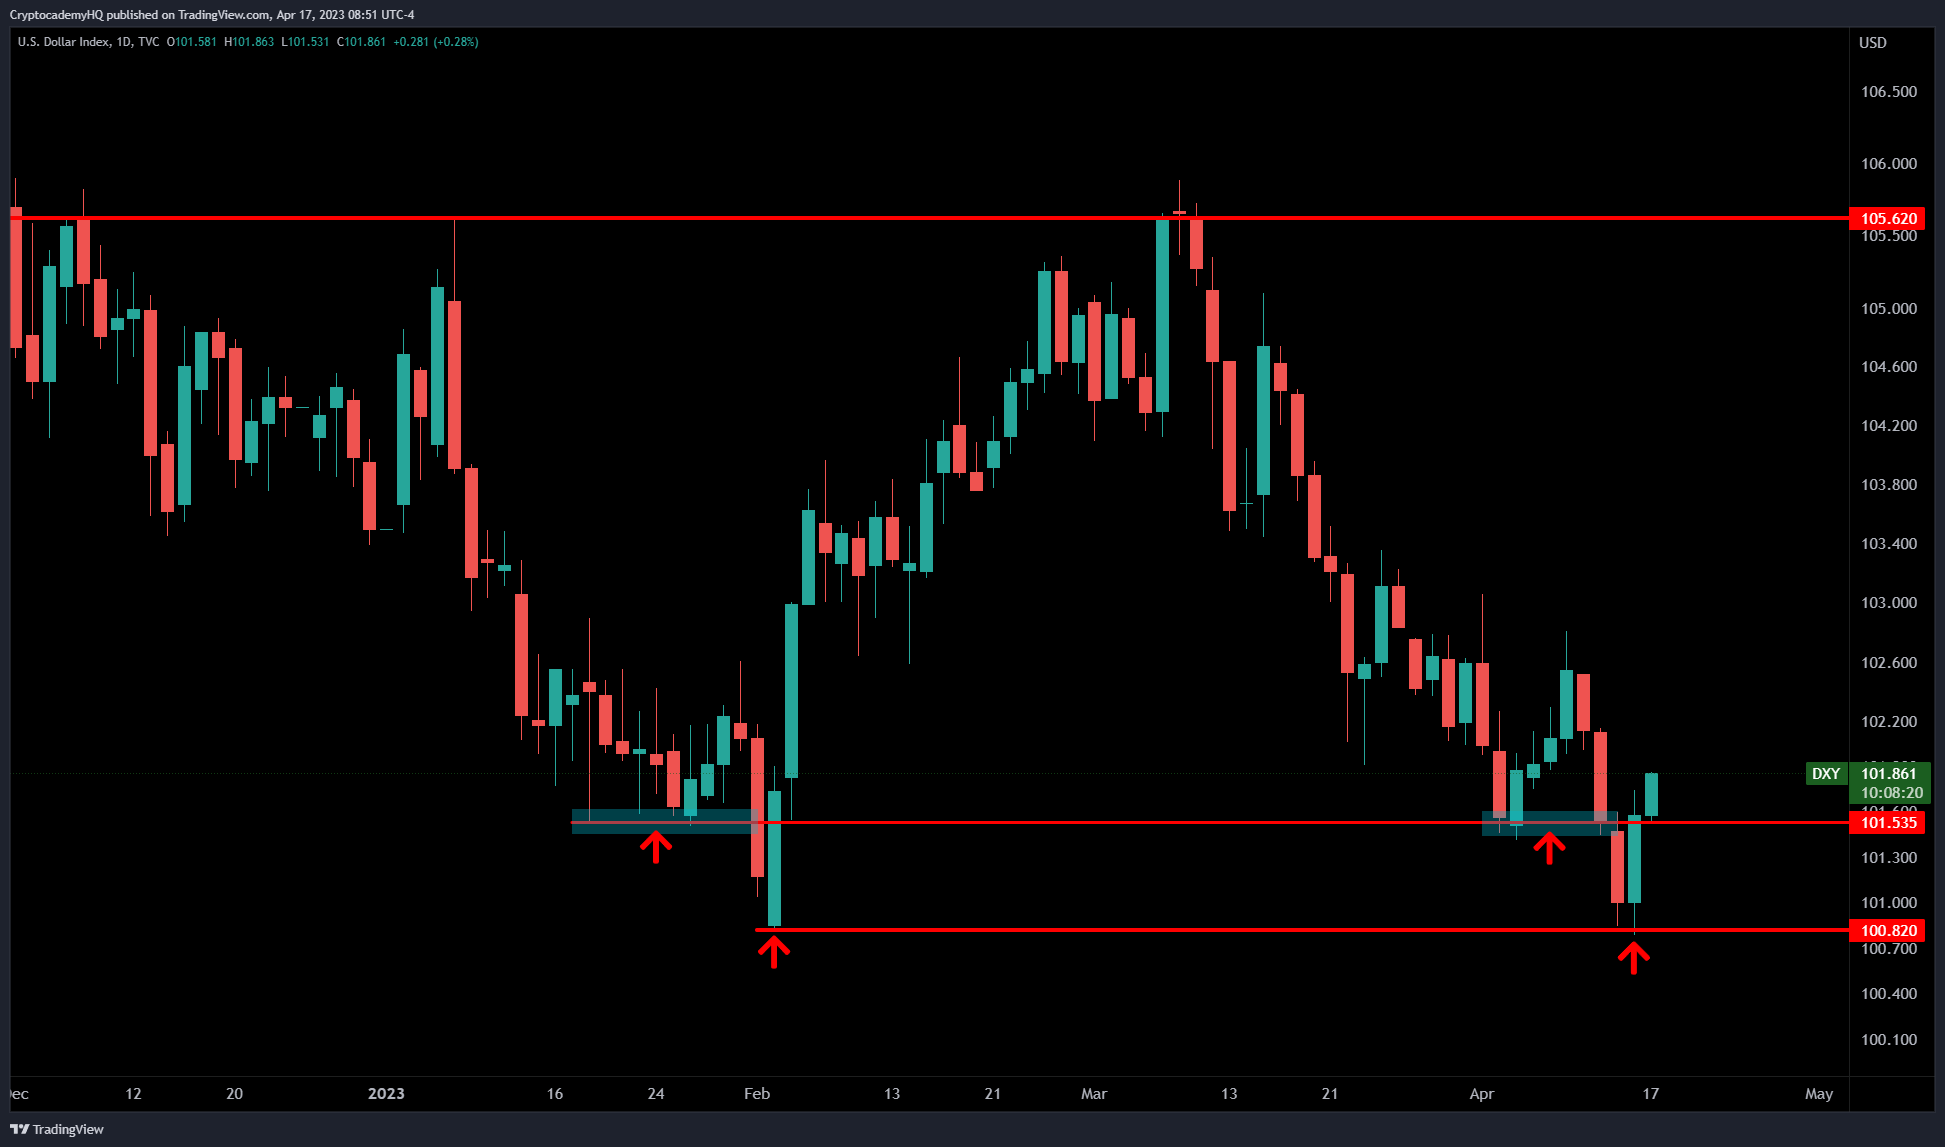
The U.S. dollar made more solid gains, with the U.S. Dollar Index (DXY) above 102 after bouncing from its lowest levels in a year.
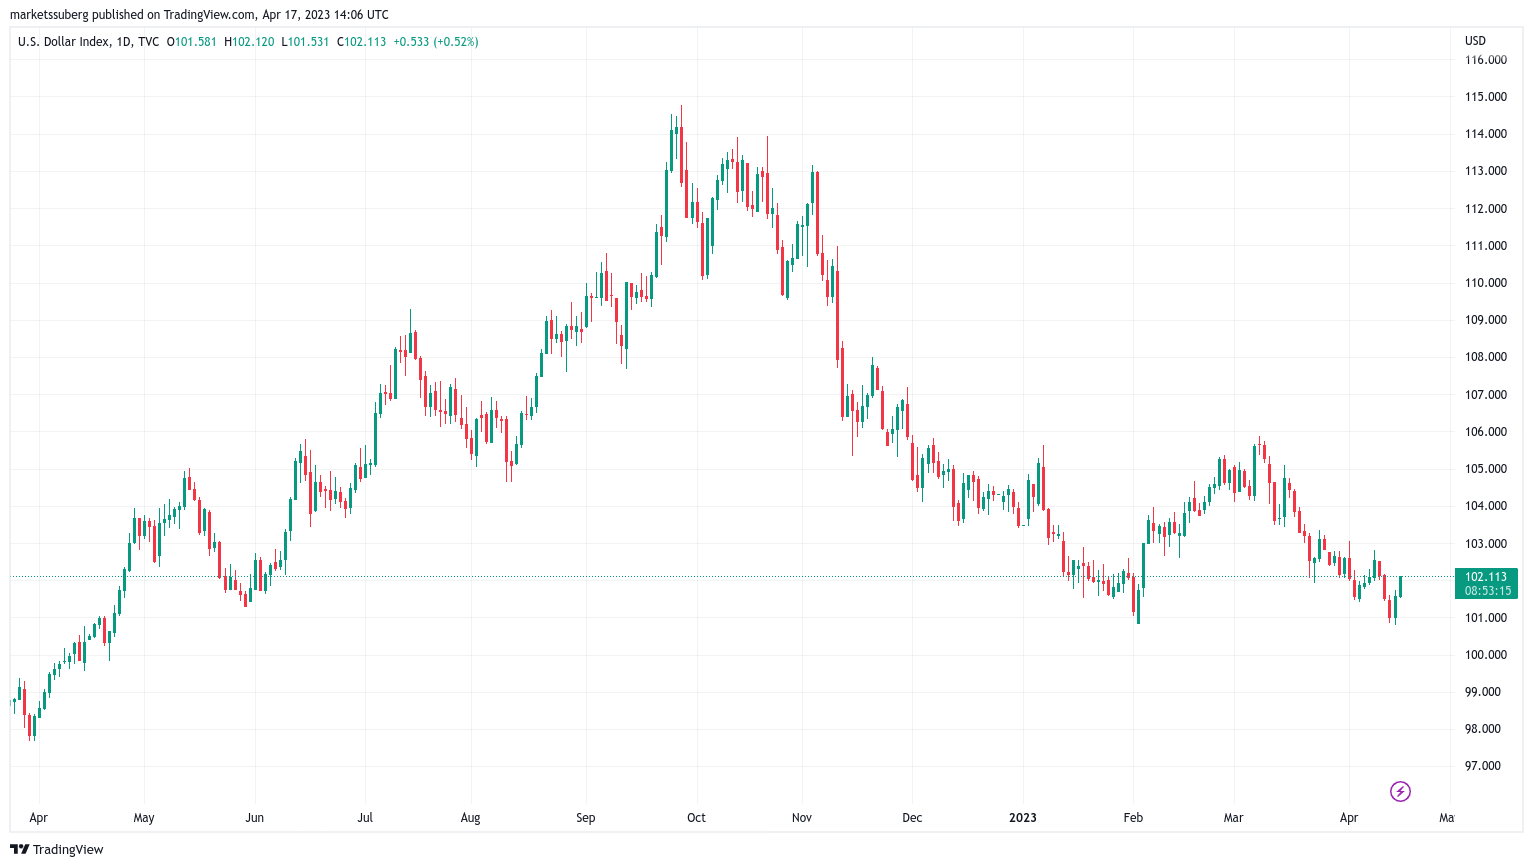
“Watch $DXY today,” analyst Justin Bennett told Twitter followers.
“If this plays out, it’ll be the most telegraphed bottom that most failed to see bc they were promised a new bull market.”
Magazine: Why join a blockchain gaming guild? Fun, profit and create better games
The views, thoughts and opinions expressed here are the authors’ alone and do not necessarily reflect or represent the views and opinions of Cointelegraph.


