Bitcoin SV Officially Flips Bitcoin Cash: 3 Signs It’s Just a Pump And Dump

Bitcoin SV price extended its rally by more than 100% and climbed above $400.00. BSV surpassed the market cap of bitcoin cash, but let’s see if this rally can continue or not.

  • Bitcoin SV price rallied significantly and above $300.00 and $400.00 against the US Dollar.
  • It exceeded the total market cap of bitcoin cash and moved to the 4th
  • There is a strong support forming near $350.00 on the 4-hours chart of the BSV/USD pair (data feed from Kraken).
  • It seems like the price is now very far from the 100 SMA (4-hours), which could result in a downside correction.

Bitcoin SV Overpowers Bitcoin Cash

In the past few days, bitcoin SV price started a strong rally above the $100.00 and $150.00 levels against the US Dollar. In yesterday’s analysis, we discussed the chances of more upsides in BSV above the $200.00 level.

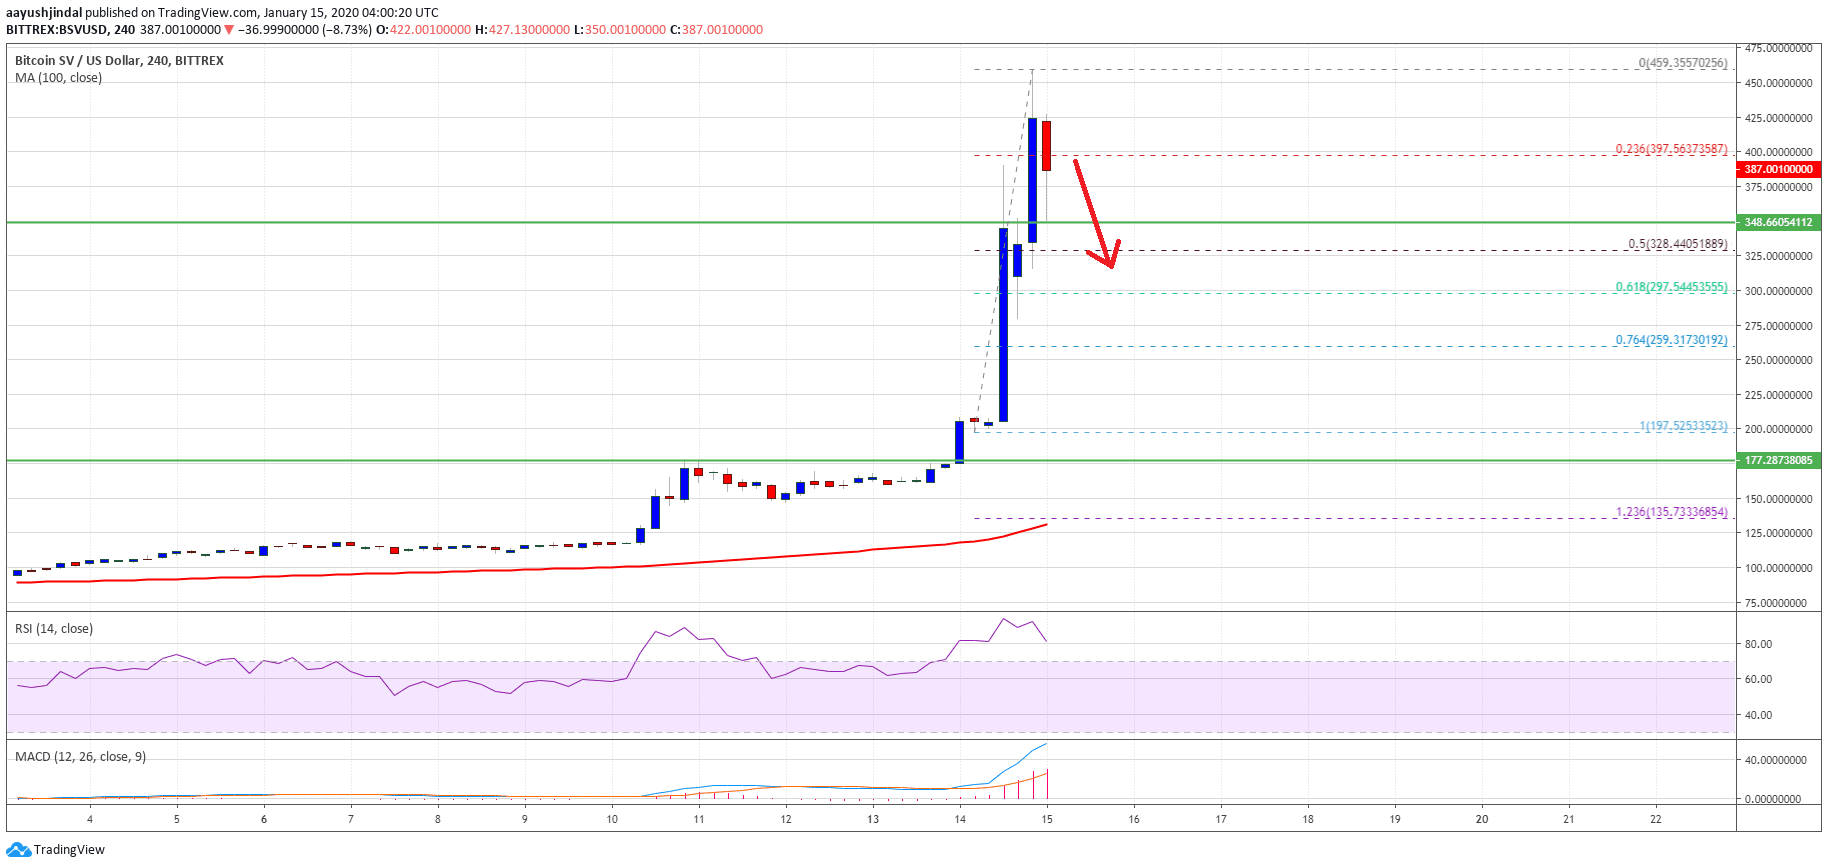
The price did break the $200.00 resistance and extended its rally by more than 100%. The bulls pushed the price above the $300.00 and $400.00 levels. A new yearly high was formed near $459.35 and BSV surpassed the market cap of BCH.

However, there are a few signs visible on the 4-hours chart of the BSV/USD pair, suggesting that the price could dip a few points. First, the price is now very far from the 100 SMA (4-hours), which could result in a downside correction.

Bitcoin SV price

Bitcoin SV price

Second: There is likely a topping pattern forming near the $450.00 level. Third, the RSI is already dipping and the price has not moved down much.

Overall, the price is likely to dip in the short term towards the $350.00 or $320.00 level. The first key support is near the $328.00 level since it is the 50% Fib retracement level of the recent rally from the $197.52 low to $459.35 high.

If there are more downsides below the $328.00 support, the bulls might start dumping and the price could decline heavily. In the mentioned case, it may perhaps move back towards $280.00 or $250.00.

Any Chances of More Upsides?

Considering the current pump, we cannot discard the chances of more upsides, especially if Craig Wright’s claim to have keys of bitcoin wallet are correct.

Conversely, if he fails to prove himself one more time, the market is likely to react very aggressively against bitcoin SV. Looking at bitcoin cash, the price is now trading nicely above the $320.00 level and it could also rise towards the $400.00 level in the coming days.

Technical indicators

Hourly MACD – The MACD for BSV/USD is currently losing pace in the bullish zone.

Hourly RSI (Relative Strength Index) – The RSI for BCH/USD is now correcting lower below the 70 level.

Key Support Levels – $350.00 and $328.00.

Key Resistance Levels – $420.00 and $450.00.

Original

Spread the love

Related posts

Leave a Comment

Bitcoin SV Officially Flips Bitcoin Cash: 3 Signs It’s Just a Pump And Dump

Bitcoin SV price extended its rally by more than 100% and climbed above $400.00. BSV surpassed the market cap of bitcoin cash, but let’s see if this rally can continue or not.

  • Bitcoin SV price rallied significantly and above $300.00 and $400.00 against the US Dollar.
  • It exceeded the total market cap of bitcoin cash and moved to the 4th
  • There is a strong support forming near $350.00 on the 4-hours chart of the BSV/USD pair (data feed from Kraken).
  • It seems like the price is now very far from the 100 SMA (4-hours), which could result in a downside correction.

Bitcoin SV Overpowers Bitcoin Cash

In the past few days, bitcoin SV price started a strong rally above the $100.00 and $150.00 levels against the US Dollar. In yesterday’s analysis, we discussed the chances of more upsides in BSV above the $200.00 level.

The price did break the $200.00 resistance and extended its rally by more than 100%. The bulls pushed the price above the $300.00 and $400.00 levels. A new yearly high was formed near $459.35 and BSV surpassed the market cap of BCH.

However, there are a few signs visible on the 4-hours chart of the BSV/USD pair, suggesting that the price could dip a few points. First, the price is now very far from the 100 SMA (4-hours), which could result in a downside correction.

Bitcoin SV price

Bitcoin SV price

Second: There is likely a topping pattern forming near the $450.00 level. Third, the RSI is already dipping and the price has not moved down much.

Overall, the price is likely to dip in the short term towards the $350.00 or $320.00 level. The first key support is near the $328.00 level since it is the 50% Fib retracement level of the recent rally from the $197.52 low to $459.35 high.

If there are more downsides below the $328.00 support, the bulls might start dumping and the price could decline heavily. In the mentioned case, it may perhaps move back towards $280.00 or $250.00.

Any Chances of More Upsides?

Considering the current pump, we cannot discard the chances of more upsides, especially if Craig Wright’s claim to have keys of bitcoin wallet are correct.

Conversely, if he fails to prove himself one more time, the market is likely to react very aggressively against bitcoin SV. Looking at bitcoin cash, the price is now trading nicely above the $320.00 level and it could also rise towards the $400.00 level in the coming days.

Technical indicators

Hourly MACD – The MACD for BSV/USD is currently losing pace in the bullish zone.

Hourly RSI (Relative Strength Index) – The RSI for BCH/USD is now correcting lower below the 70 level.

Key Support Levels – $350.00 and $328.00.

Key Resistance Levels – $420.00 and $450.00.

CryptoX Portal

Spread the love

Related posts

Leave a Comment