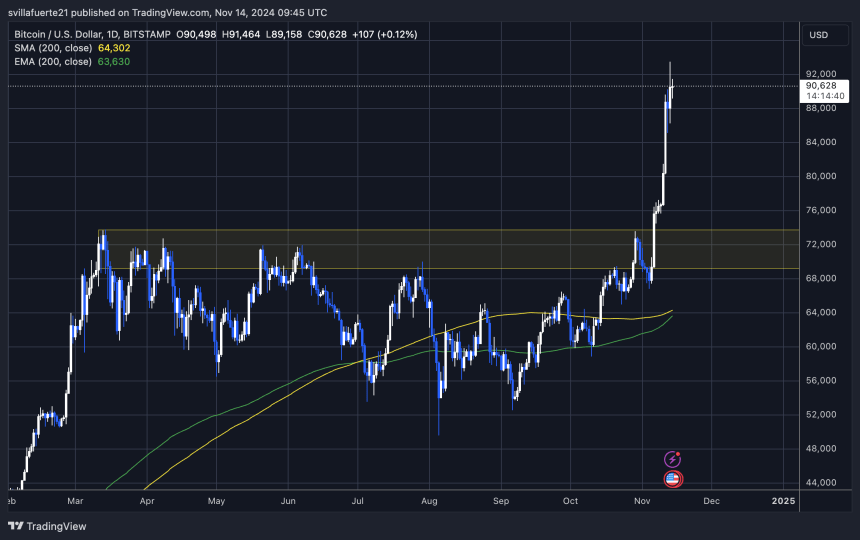
Bitcoin set a new all-time high yesterday, reaching $93,483, continuing its impressive rally without significant setbacks. Over the past nine days, the crypto leader has surged with minimal dips, not falling more than 5% during this bullish phase. This relentless price action has drawn widespread attention as Bitcoin defies expectations and resists any notable pullback.
Related Reading
Key data from CryptoQuant reveals that traders’ unrealized profit margins are climbing, indicating that the market may be nearing a short-term peak. High unrealized profit levels typically signal that a correction could be on the horizon as investors look to secure gains. However, given the current strength of Bitcoin’s price action, the timing and scale of any correction remain uncertain.
With Bitcoin’s price momentum showing few signs of slowing down, the coming days will be crucial in determining whether the market can sustain these levels or if a healthy retrace is in store. Investors are closely watching for potential entry points and key support levels, knowing that even minor dips could trigger strong buying interest as Bitcoin’s bullish phase persists.
Bitcoin Strong Move About To Pause?
Bitcoin’s price action has been remarkable, surging 38% since the U.S. election and capturing widespread attention with its unrelenting bullish momentum. However, this aggressive rally may be approaching a temporary pause, as data hints at a potential correction.
CryptoQuant’s head of research, Julio Moreno, recently shared a compelling chart highlighting Bitcoin traders’ unrealized profit margins, which have reached 47% — a level that has often preceded price pullbacks.
High unrealized profit margins can indicate that traders are sitting on significant gains, raising the likelihood of profit-taking that could trigger a market cooldown. Moreno’s analysis notes that this metric tends to correlate with a heightened risk of a correction when it surpasses certain thresholds. For instance, prior peaks in March reached 69%, while December 2023 saw unrealized profits hit 48%, both instances that led to notable corrections shortly after.
Still, the current 47% level suggests that, while caution may be warranted, Bitcoin’s bullish phase still has room to run. Past cycles demonstrate that the market has tolerated even higher unrealized profits before reversing. The data implies that while a pullback may be on the horizon, Bitcoin could continue its upward trend a bit longer before any significant cooling occurs.
Related Reading
In the coming days, investors will be watching closely for any signs of a consolidation phase or a potential retracement. Should Bitcoin maintain strong support levels, continuing this bull run remains plausible. However, if profit-taking intensifies, a correction could provide a healthy reset for Bitcoin to gather momentum for future gains.
BTC Breaking ATH Almost Every Day
Bitcoin has shattered its all-time high seven times over the past eight days, fueling a highly bullish sentiment across the market. Currently trading at $90,620 after peaking at $93,483, Bitcoin’s price action remains strong, signaling sustained buying momentum. This surge has set a notably optimistic tone, but a brief correction period could provide a necessary reset after such an extended upward push.

Given the high buying pressure, a short-term pullback to establish a new market equilibrium would be a healthy development. This could allow Bitcoin to test lower demand levels and establish stronger support areas for its next leg up. If profit-taking intensifies in the near term, BTC could revisit the $85,000 mark as it seeks to stabilize.
Related Reading
In the coming days, investors will likely watch for this potential consolidation phase to gauge Bitcoin’s resilience. A successful retest of support around $85,000 would reaffirm confidence in the ongoing bull market, providing a stronger foundation for Bitcoin to push toward even higher levels. Overall, while the trend remains bullish, a balanced correction may be just what the market needs to maintain its momentum over the long term.
Featured image from Dall-E, chart from TradingView


