
Bitcoin (BTC) aimed for $28,500 at the Oct. 2 Wall Street open as a bullish start to the month continued.
Analyst wary of Bitcoin “upside wick” fakeout
Data from Cointelegraph Markets Pro and TradingView showed BTC price action staying strong into October’s first United States trading session.
The largest cryptocurrency made swift gains into the weekly close, this following a contrastingly cool monthly candle completion which saw BTC/USD finish on $26,970.
For popular trader and analyst Rekt Capital, this monthly close — despite now being more than 5% below spot price — called for caution.
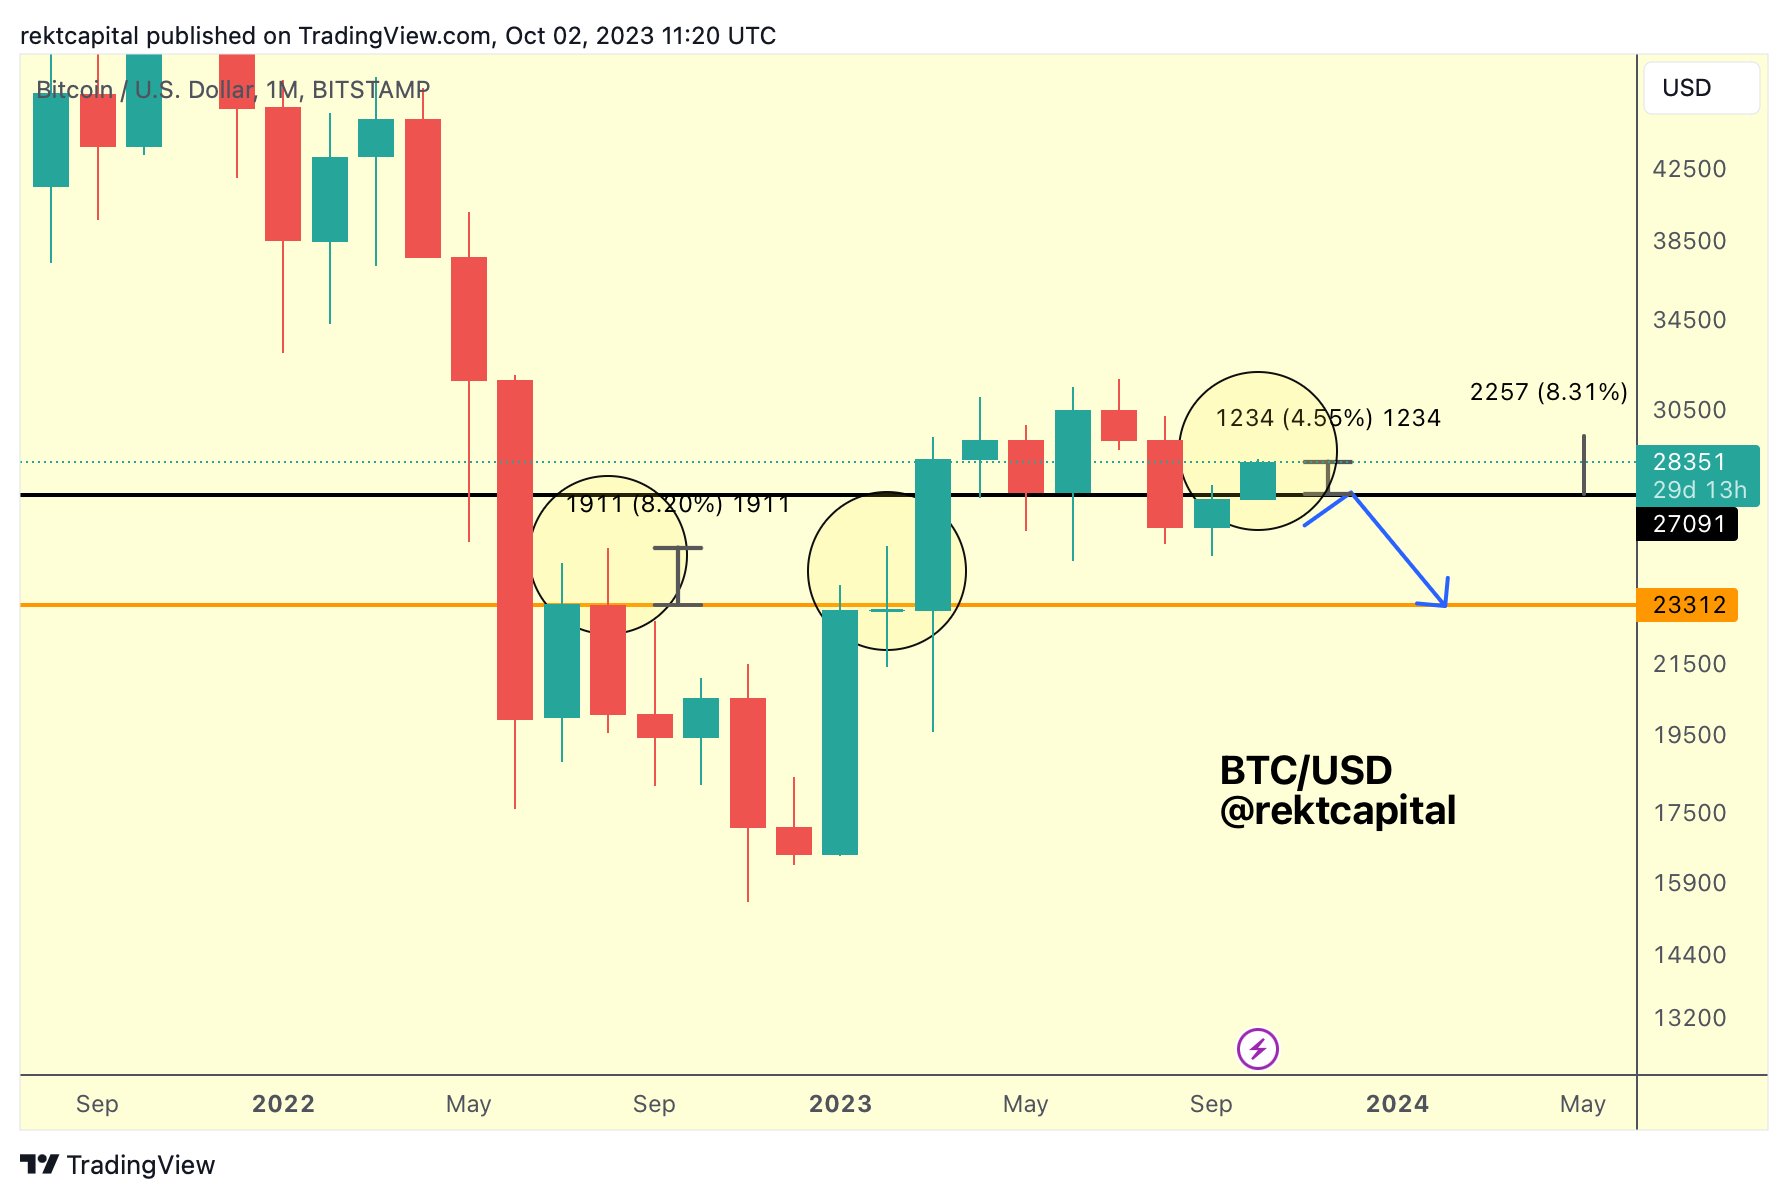
“Bitcoin performed a September Monthly Candle Close below ~$27,100 (black),” he wrote in part of the day’s X analysis alongside an explanatory chart.
“Technically, black was solidified as resistance for September.”
Rekt Capital acknowledged the October breakout, and that this would “invalidate the bearish predicament” should it endure.
“But because BTC Monthly Closed below black, there is always going to be a chance that this price action could end up as an upside wick,” he continued.
“Bitcoin has offered upside wicks of up to +8% long before. Right now, BTC is up +4.5% this month. So technically, anything up to ~$29400 (+8%) could theoretically end as an upside wick.”
Closer to home, market observers noted ongoing encouraging signals on exchange order books.
“Spot bid continues, while funding is negative. This reeks of disbelief,” popular trader Jelle suggested as a result.
Fellow trader Skew noted that spot markets were driving the move after the Wall Street open, displaying an “interesting disconnect” with derivatives.
$BTC
Still spot driven, perps havent done much yet tbh https://t.co/LSlt1oYrYo pic.twitter.com/xqauLr2vY6— Skew Δ (@52kskew) October 2, 2023
Bitcoin shrugs off fresh U.S. dollar surge
Just as eager to hit new local highs on the day, meanwhile, was the U.S. dollar.
Related: BTC price hits ‘Uptober’ up 5% — 5 things to know in Bitcoin this week
After Congress avoided a government shutdown, the U.S. dollar index (DXY) staged a sharp rebound from losses seen late last week.
At the time of writing, DXY circled 106.7, barely 0.2 points off its recent 2023 highs.
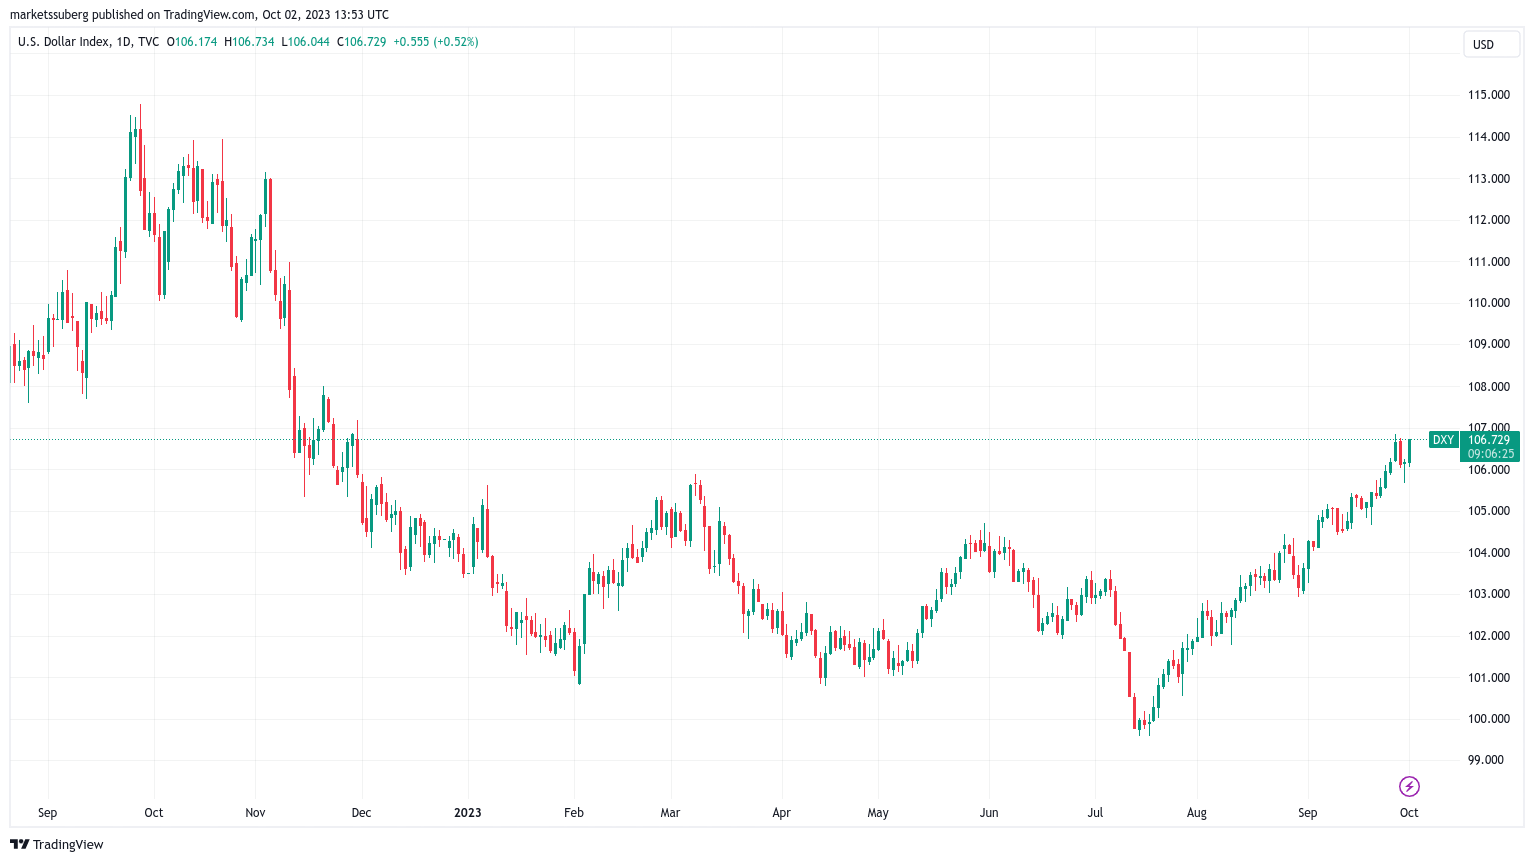
For crypto analyst Nebraskan Gooner, a breakout from here would put 108 in play — marking new 11-month highs.
Continuation so far.
Break this local resistance to fly to $108 https://t.co/ii4UOhNBk9 pic.twitter.com/2pVnfuWbGZ
— Nebraskangooner (@Nebraskangooner) October 2, 2023
Together with higher bond yields and oil prices, Economist Mohamed El-Erian described the DXY strength as “neither the US economy (particularly, growth and financial stability) nor the markets enjoy.”
Bitcoin nonetheless remained conspicuously unfazed.
This article does not contain investment advice or recommendations. Every investment and trading move involves risk, and readers should conduct their own research when making a decision.


