Bitcoin (BTC) volatility cooled above $17,000 into the Dec. 5 Wall Street open as traders confirmed upside targets.
Bitcoin traders warm to near-term upside
Data from Cointelegraph Markets Pro and TradingView followed BTC/USD as it held overnight gains, having hit three-week highs.
The weekly close was encouraging for some, forming Bitcoin’s highest since the FTX scandal broke.
Now, traders are hoping that upside will continue toward $20,000, with various resistance zones in play.
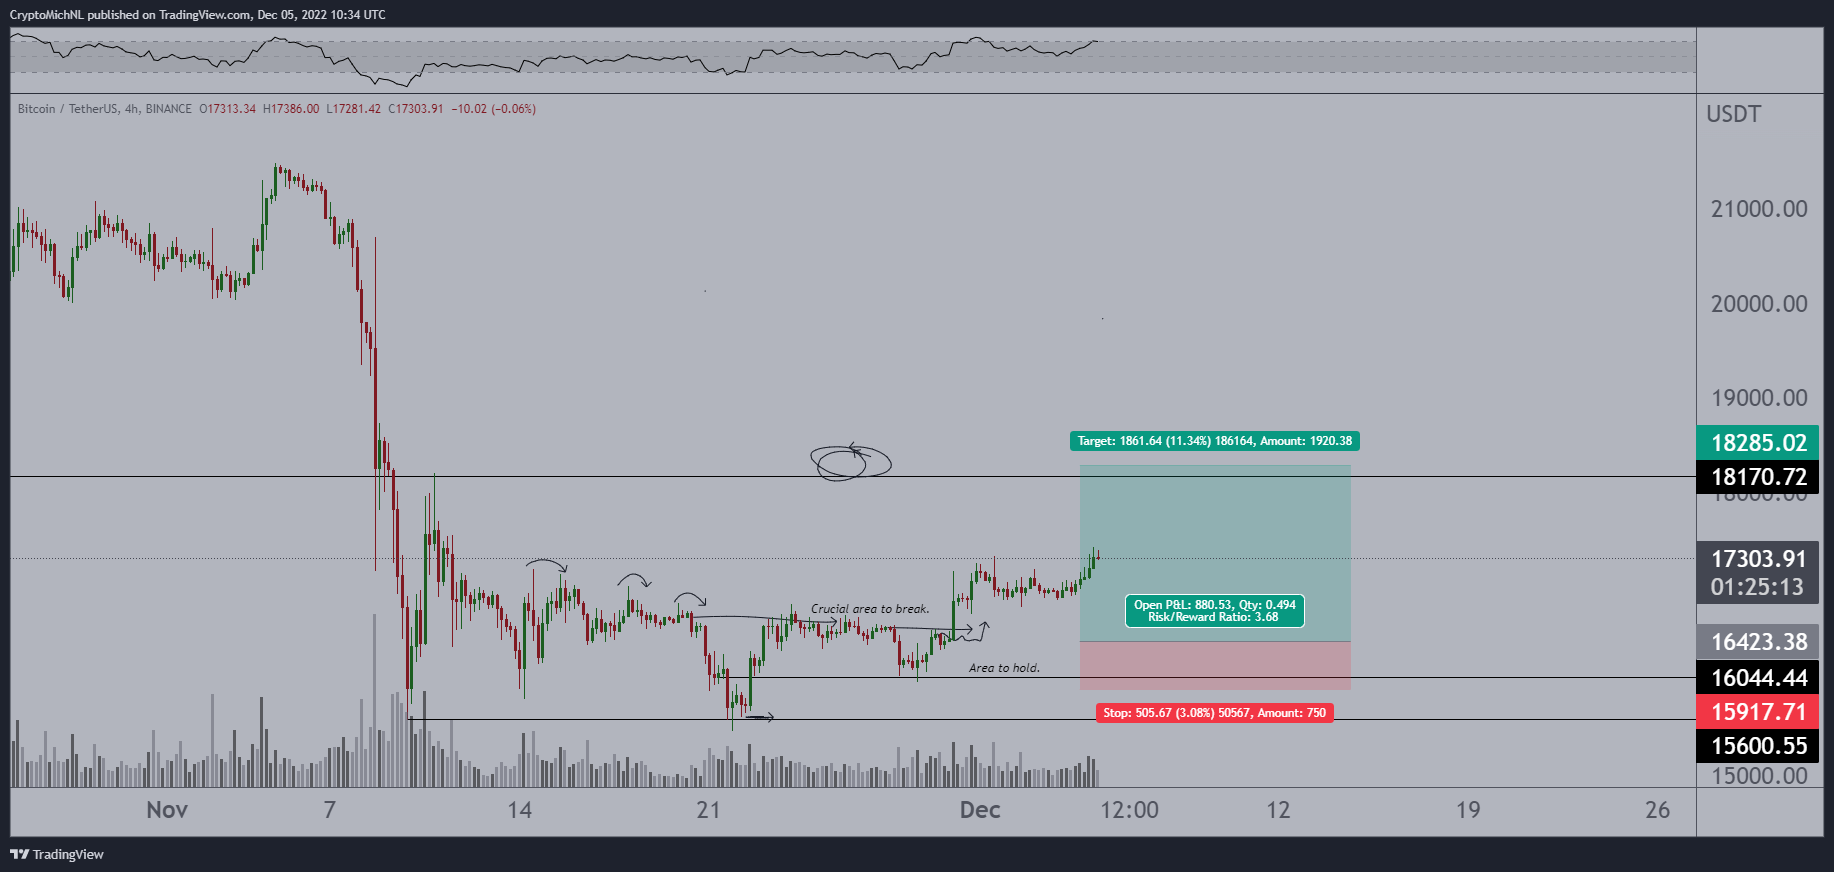
“Slowly, but surely, Bitcoin is grinding upwards. Needs to crack $17.4-17.6K, but then we most likely continue quite fastly towards $19K,” Michaël van de Poppe, founder and CEO of trading firm Eight, wrote in an update.
A further post offered a BTC/USD chart with relevant price levels of interest.
Fellow trader Titan of Crypto flagged $18,500 as a formidable resistance zone to watch, while a daily close above $17,167 would be “encouraging.”
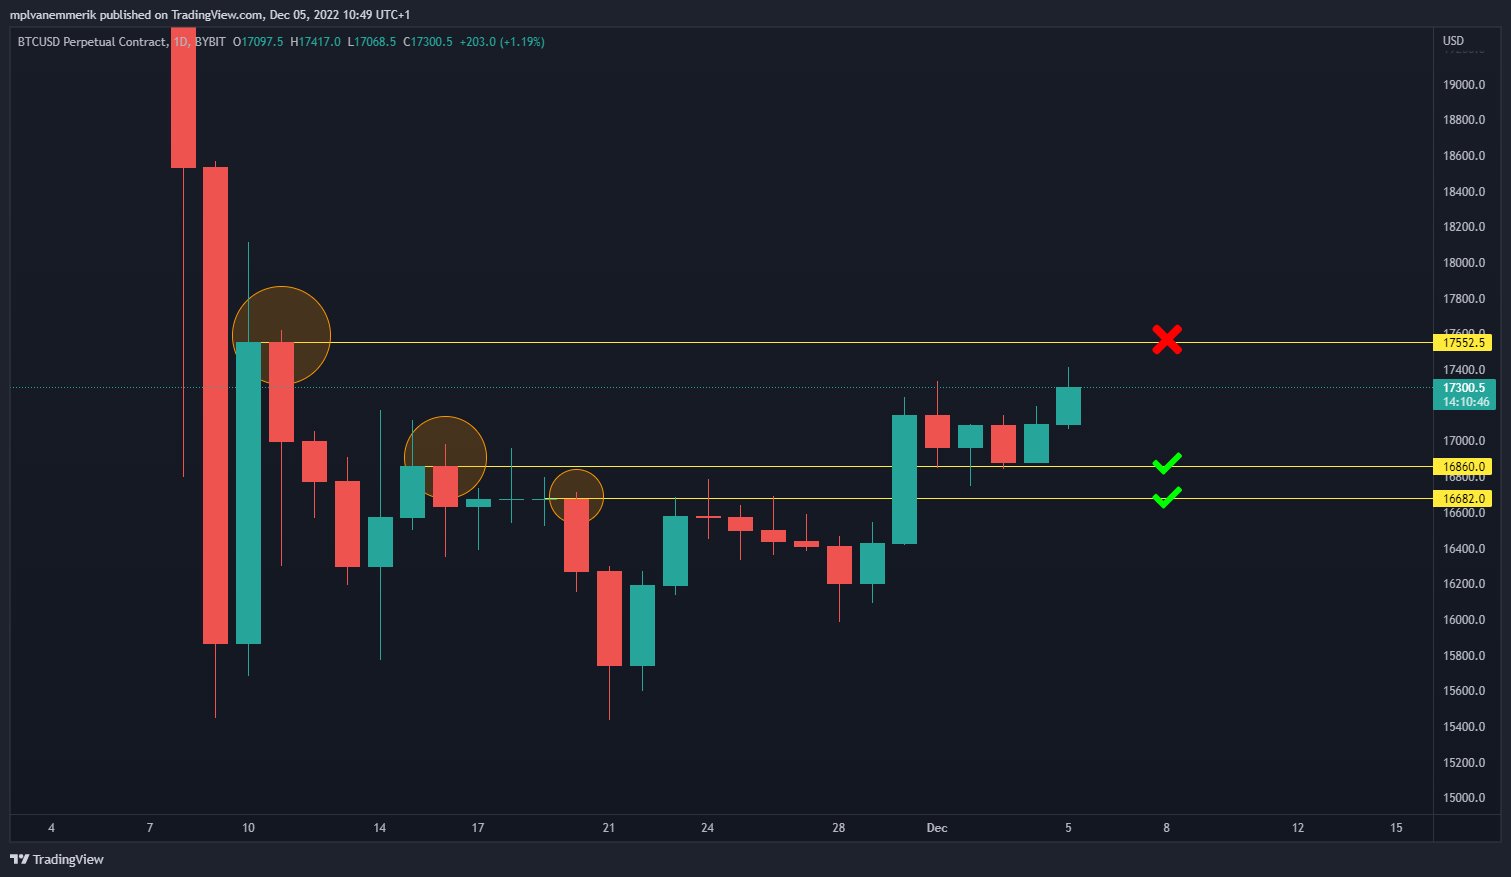
“Are we leaving the range this week?” trader DoopieCash queried alongside a chart showing $17,552 as clinch level on daily timeframes.
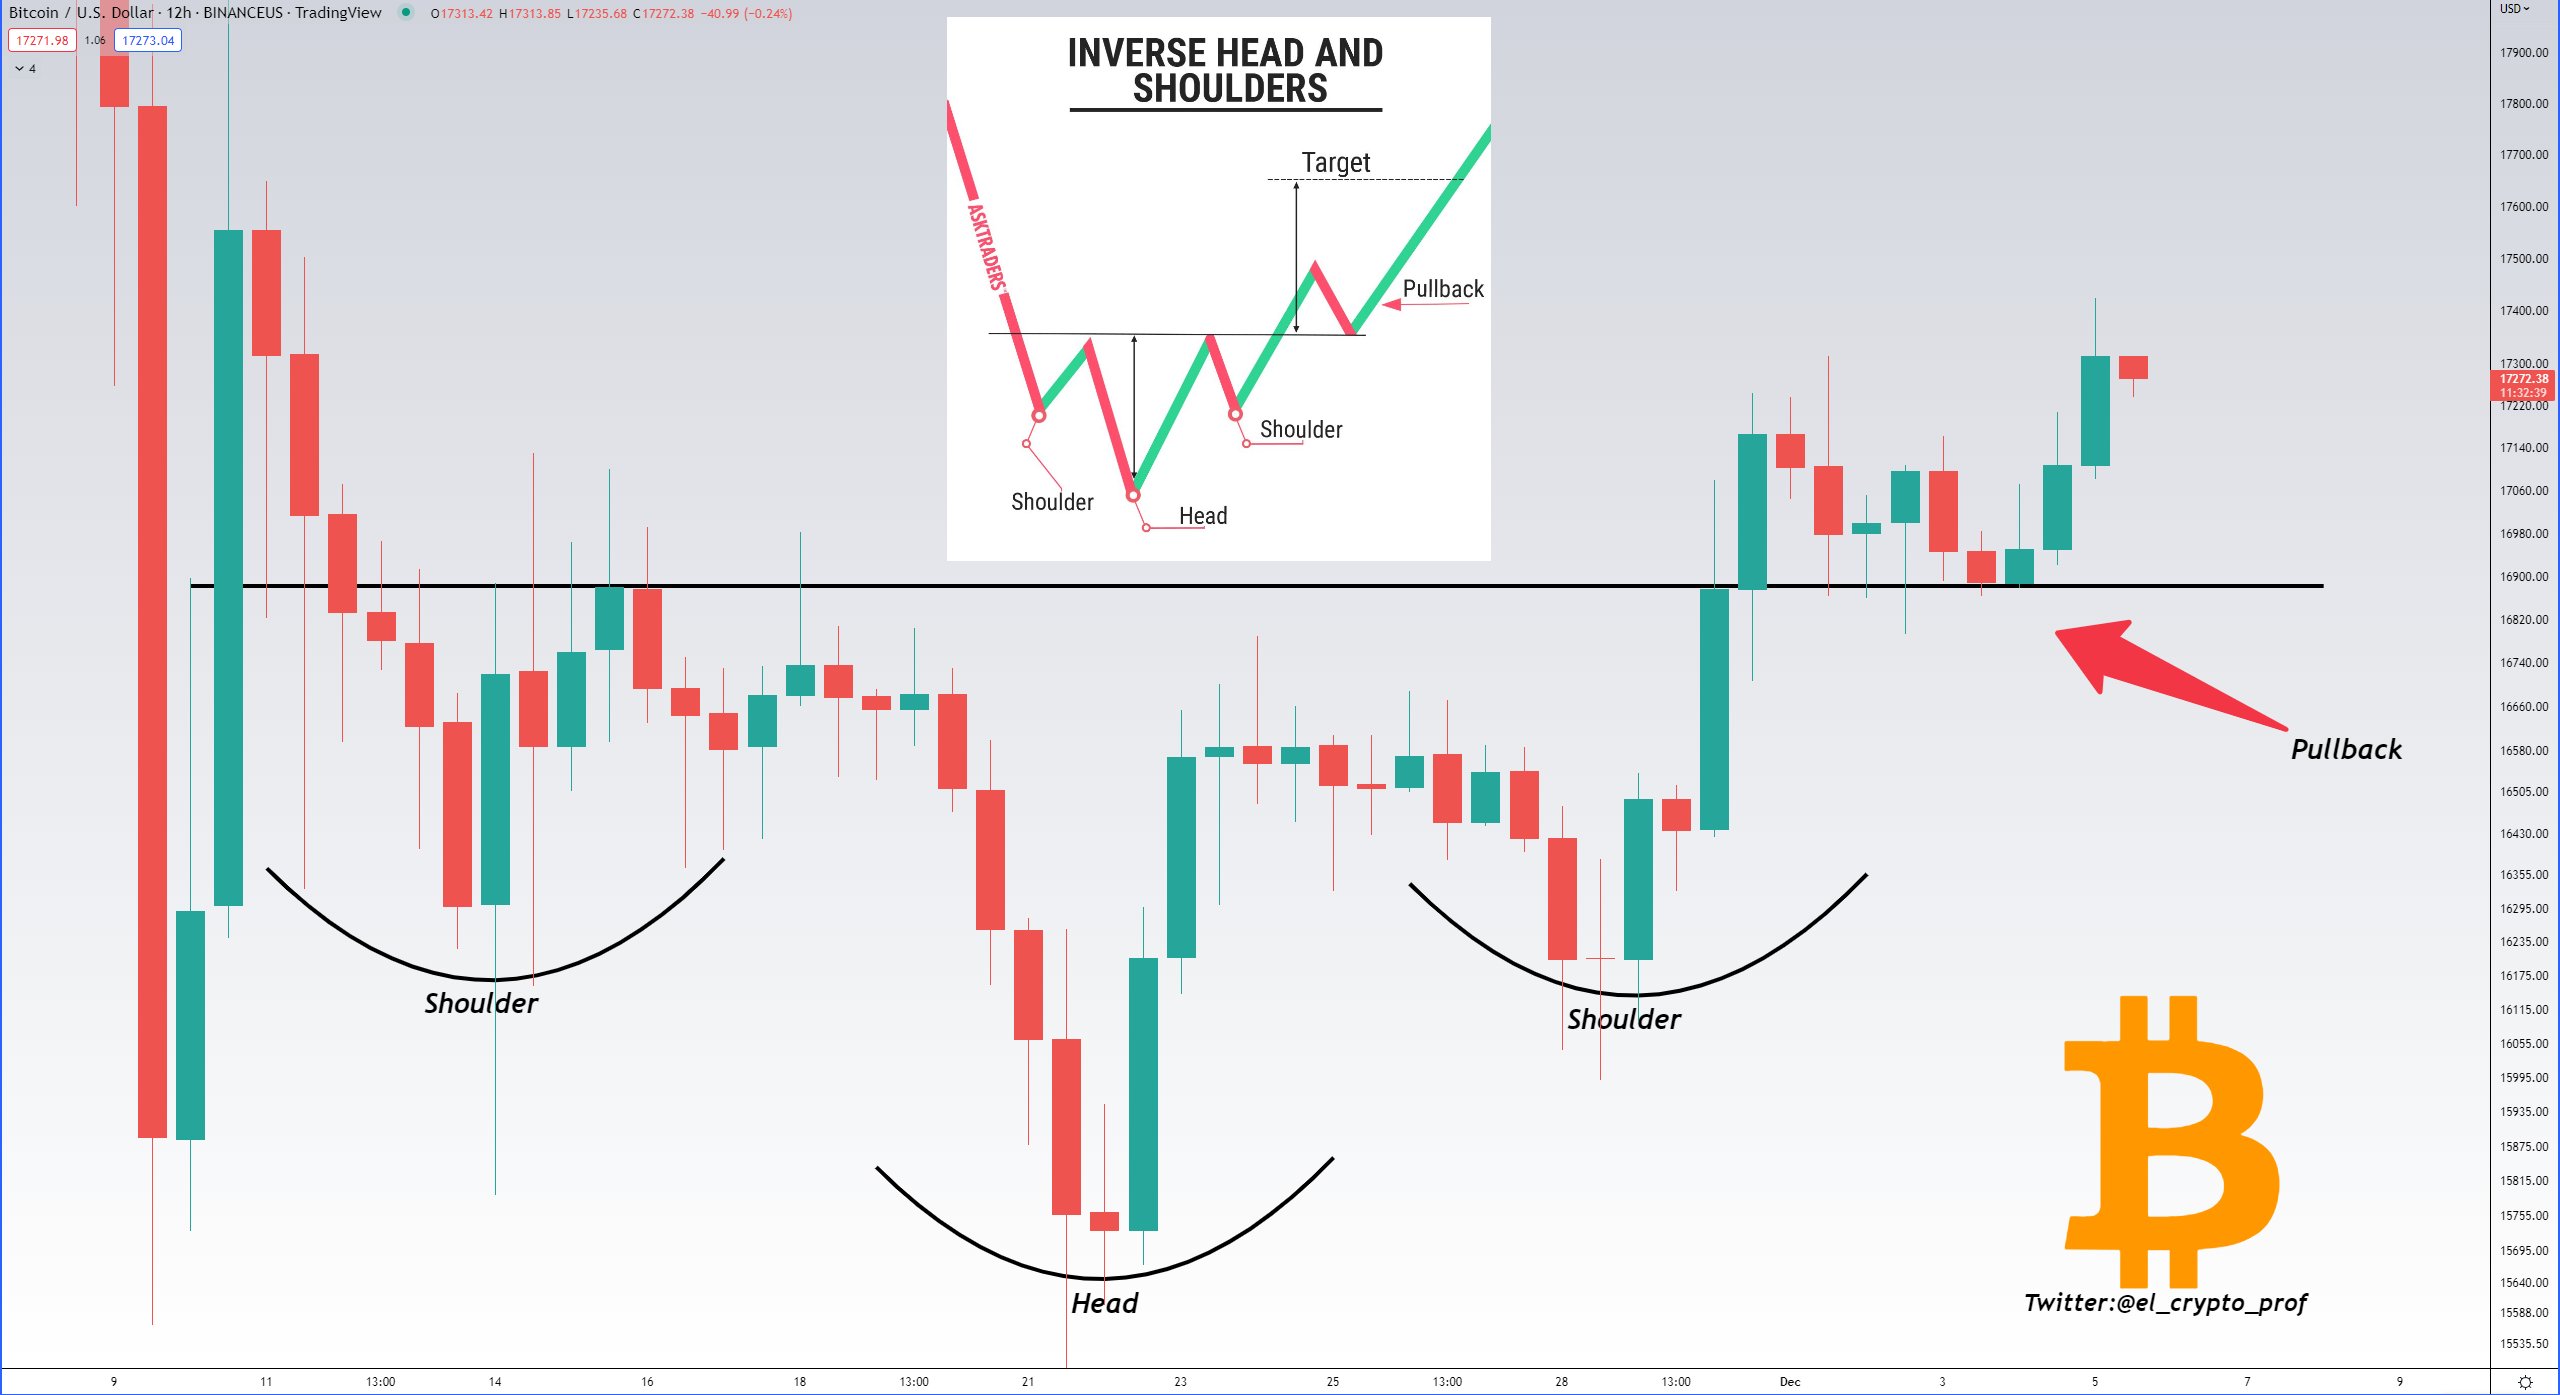
A still-optimistic trader who tweets under the alias “Moustache” meanwhile pointed to a classic bottoming pattern — the inverse head and shoulders — “in full swing” on the 12-hour chart.
Dollar strength faces tense week
Eyes were meanwhile on United States equities after Asian markets had another strong day’s trading.
Related: ‘Imminent’ crash for stocks? 5 things to know in Bitcoin this week
Hong Kong’s Hang Seng was up 4.5% on the day, while the Shanghai Composite Index managed a nearly 1.8% gain.
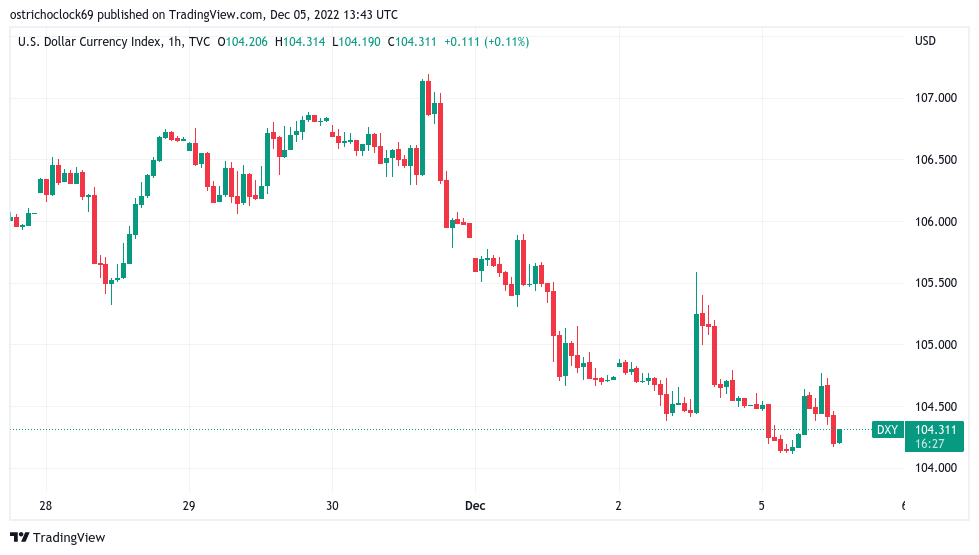
The U.S. dollar remained a focus within the macro picture, with the U.S. Dollar Index (DXY) near five-month lows in what could yet be a boon for Bitcoin.
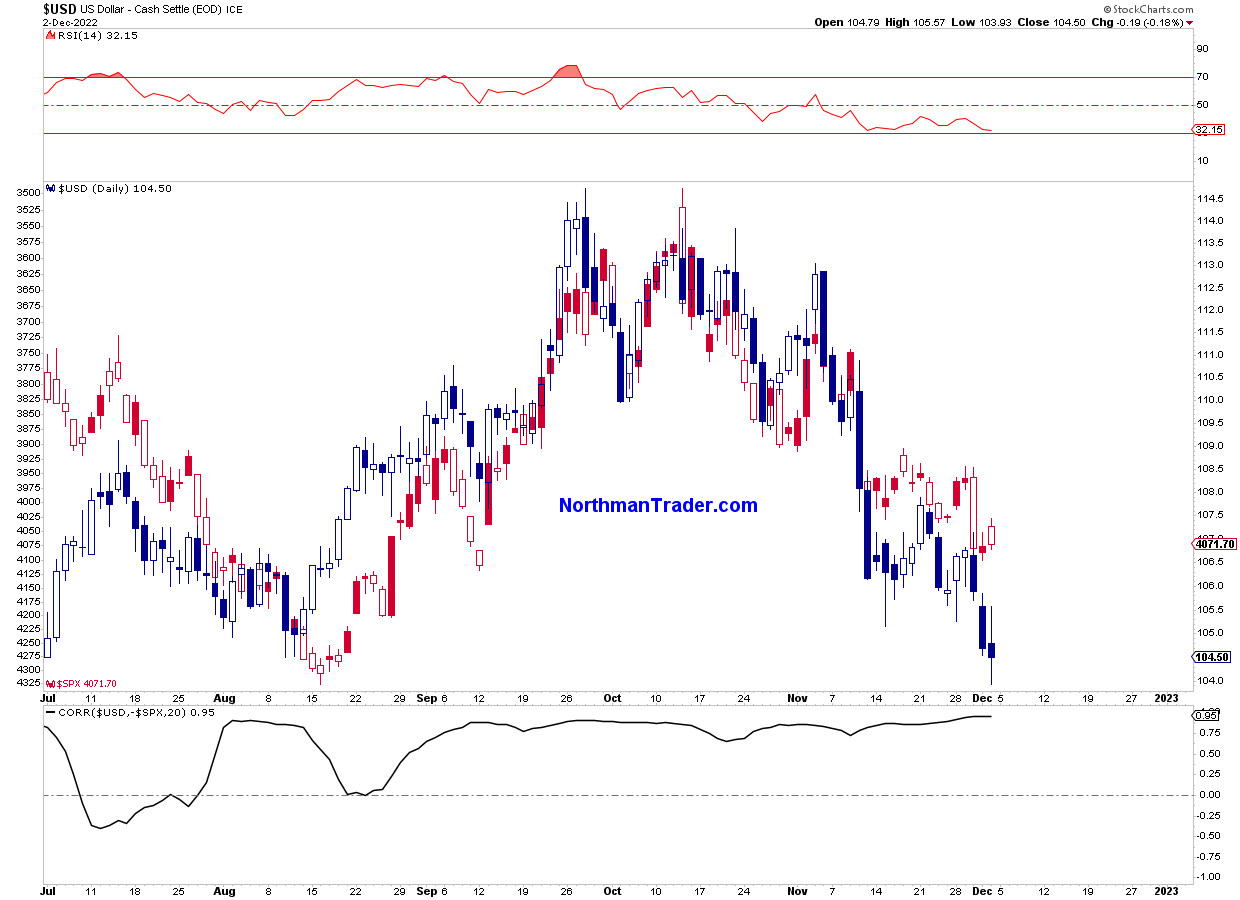
Sven Henrich, founder of NorthmanTrader, meanwhile noted the ongoing inverse correlation between DXY and the S&P 500.
“A key chart to navigating markets in past few months: The US dollar $SPX directional correlation. Still sitting at 95%,” he tweeted.
The views, thoughts and opinions expressed here are the authors’ alone and do not necessarily reflect or represent the views and opinions of Cointelegraph.

