Bitcoin (BTC) held steady at the June 20 Wall Street open as nervous traders waited for a short-term trend decision.
Trader flags Bitcoin “macro bottoming period”
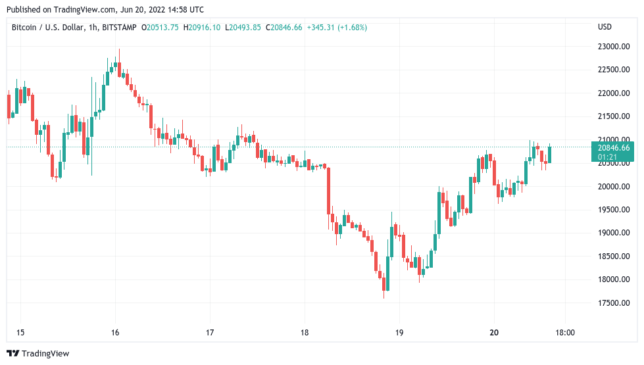
Data from Cointelegraph Markets Pro and TradingView showed BTC/USD climbing to just shy of $21,000 at the time of writing, a three-day high.
The weekend had spooked the majority of the market and liquidated speculators with a trip to $17,600, marking Bitcoin’s lowest levels since November 2020.
Now, with United States equities cool at the start of the week, comparative calm characterized the largest cryptocurrency.
“Nice reaction off of the bottom of our 16K–20K demand zone,” popular trading account Credible Crypto commented on the weekend’s price action.
“12 hours of bleeding erased in 2. No confirmation this is the reversal yet though. Focus on key HTF levels and don’t get too caught up staring at the red 5-minute candles — they can be erased in an instant.”
When in doubt, zoom out
— Crypto Tony (@CryptoTony__) June 20, 2022
The idea of focusing on HTF, or higher timeframe price structures was shared by various commentators as the week began.
“BTC is in a macro bottoming period for this cycle,” fellow trader and analyst Rekt Capital continued.
“Over the next years, investors will be rewarded for buying here. Yet, many still wait for $BTC to go even lower to buy. It’s like waiting for Summer to come, and finally it’s 33C outside but now we hope for 35C.”
Rekt Capital additionally described a $20,000 BTC price as a “gift” to buyers.
“BTC data science shows that anything below $35,000 is an area that has historically yielded outsized ROI for long-term Bitcoin investors,” part of a tweet on the day read.
On-chain analytics resource Whalemap meanwhile highlighted dip-buying by major investors at levels below the seminal $20,000.
New whale level has formed over the weekend’s dump.
The accumulation is quite large, >100k BTC, and happened on the 18th of June.
Prior to that, a large portion of Dec 2018 Bitcoins have moved from the previous 4k bottom… Could be OTC
Looks like a great short-term support pic.twitter.com/rJbV26ZifG
— whalemap (@whale_map) June 20, 2022
PlanB: Bitcoin is simply “oversold”
Bitcoin heading below its prior halving cycle all-time high, meanwhile, increased pressure on the popular stock-to-flow (S2F) BTC price models — and criticism of them.
Related: ‘Worst quarter ever’ for stocks — 5 things to know in Bitcoin this week
As market analyst Zack Voell openly called S2F a “scam” on social media, quant analyst PlanB, its creator, maintained that the theory behind it remained sound.
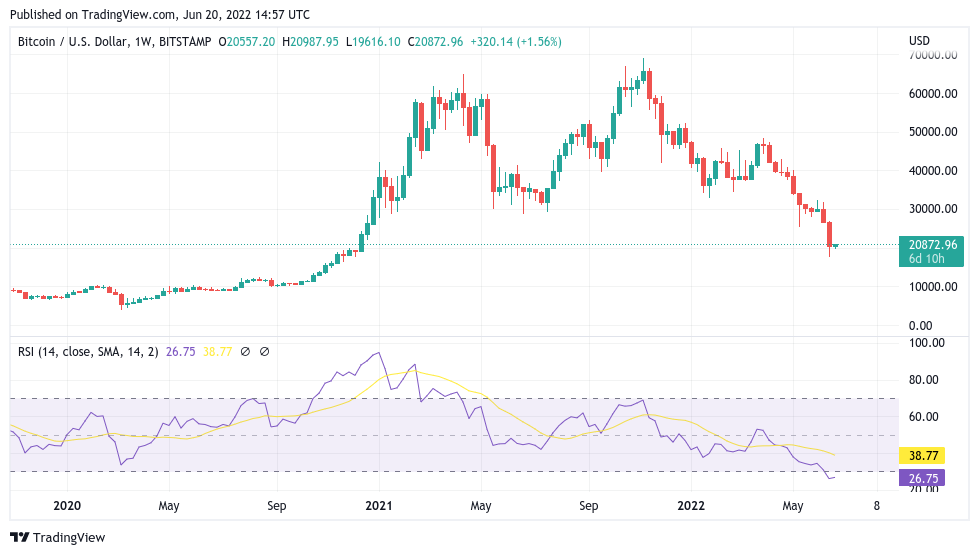
“Most indicators (S2F, RSI, 200WMA, Realized, etc.) are at extreme levels,” he explained in part of a Twitter post on June 18.
“Does that mean that all indicators are ‘invalidated’ ‘debunked’? No. Investing is a game of probabilities and indicators give situational awareness: BTC is oversold.”
Voell’s comments had come after BTC/USD dipped below the second standard deviation band relative to the S2F predicted price for the first time.
Bitcoin isn’t dead.
But the Stock-to-Flow scam absolutely is. pic.twitter.com/ZYZ0NR8n92
— Zack Voell (@zackvoell) June 19, 2022
As PlanB noted, Bitcoin’s relative strength index, or RSI, was at its lowest level in history over the weekend. A classic overbought vs. oversold indicator, RSI essentially suggests that BTC/USD is trading much lower than its fundamentals warrant, based on historical context.
The views and opinions expressed here are solely those of the author and do not necessarily reflect the views of Cointelegraph.com. Every investment and trading move involves risk, you should conduct your own research when making a decision.


