
Bitcoin (BTC) struck at ask liquidity at Tuesday’s Wall Street open as markets reacted to mixed US employment data.
Key points:
-
Bitcoin buyers and sellers square off for control amid conflicting US employment numbers.
-
Nearby order-book liquidity begins to get shaken out at the Wall Street open.
-
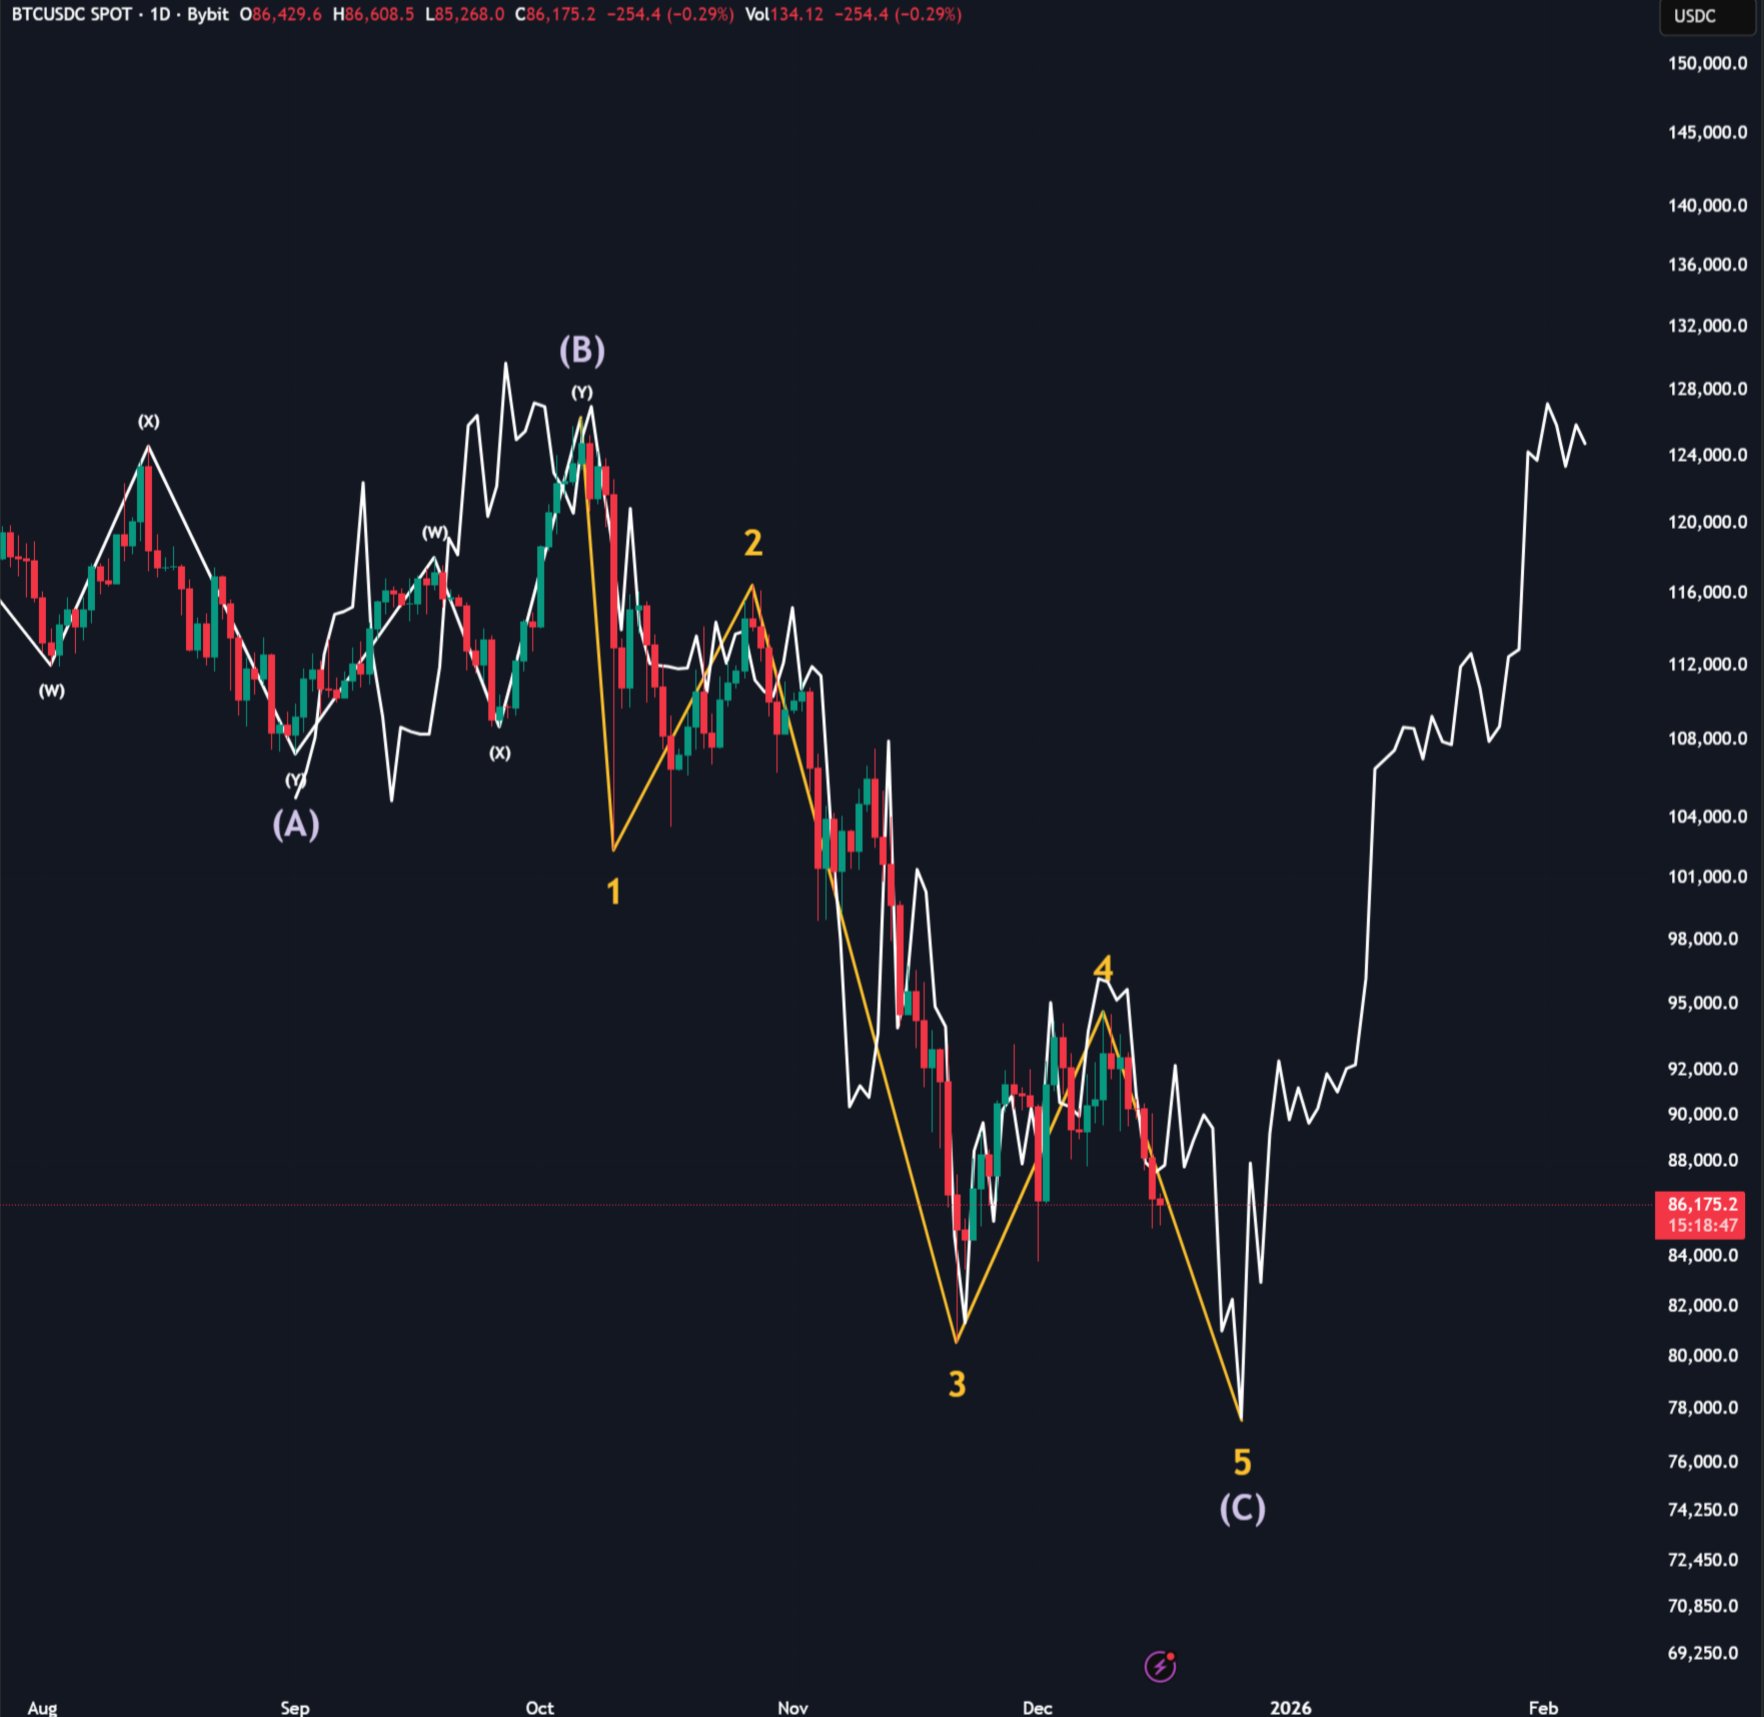
BTC price targets include $95,000 in the event of a bullish impulse on short timeframes.
Bitcoin order-book “battle” commences at $87,000
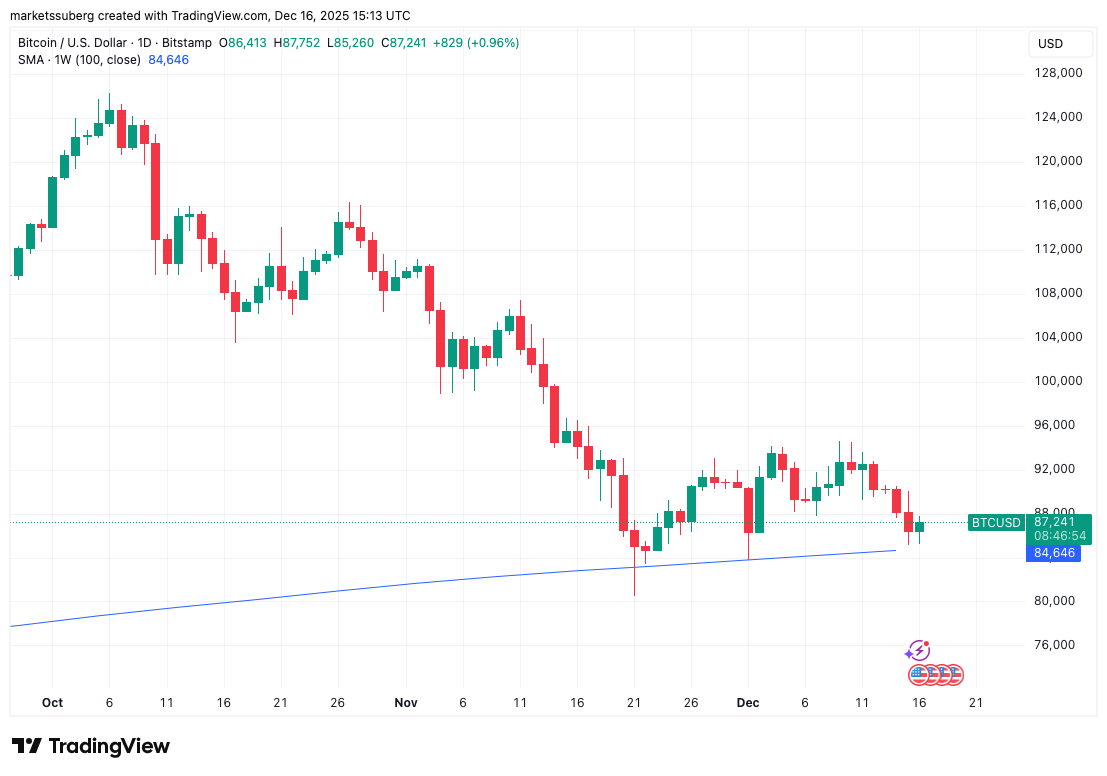
Data from Cointelegraph Markets Pro and TradingView showed that bulls were grappling with resistance above $87,000.
After dropping to nearly $85,000 the day prior, tensions were high as buyers sought to avoid another “manipulative” sell-off during US trading.
“Waking up to a battle in the $BTC order book…,” trading resource Material Indicators wrote in a post on X alongside Binance order-book liquidity data.
“Bid liquidity is concentrating at $85k to defend support at the 100-Week SMA… Meanwhile asks are stacking above $87k to suppress a break out.”
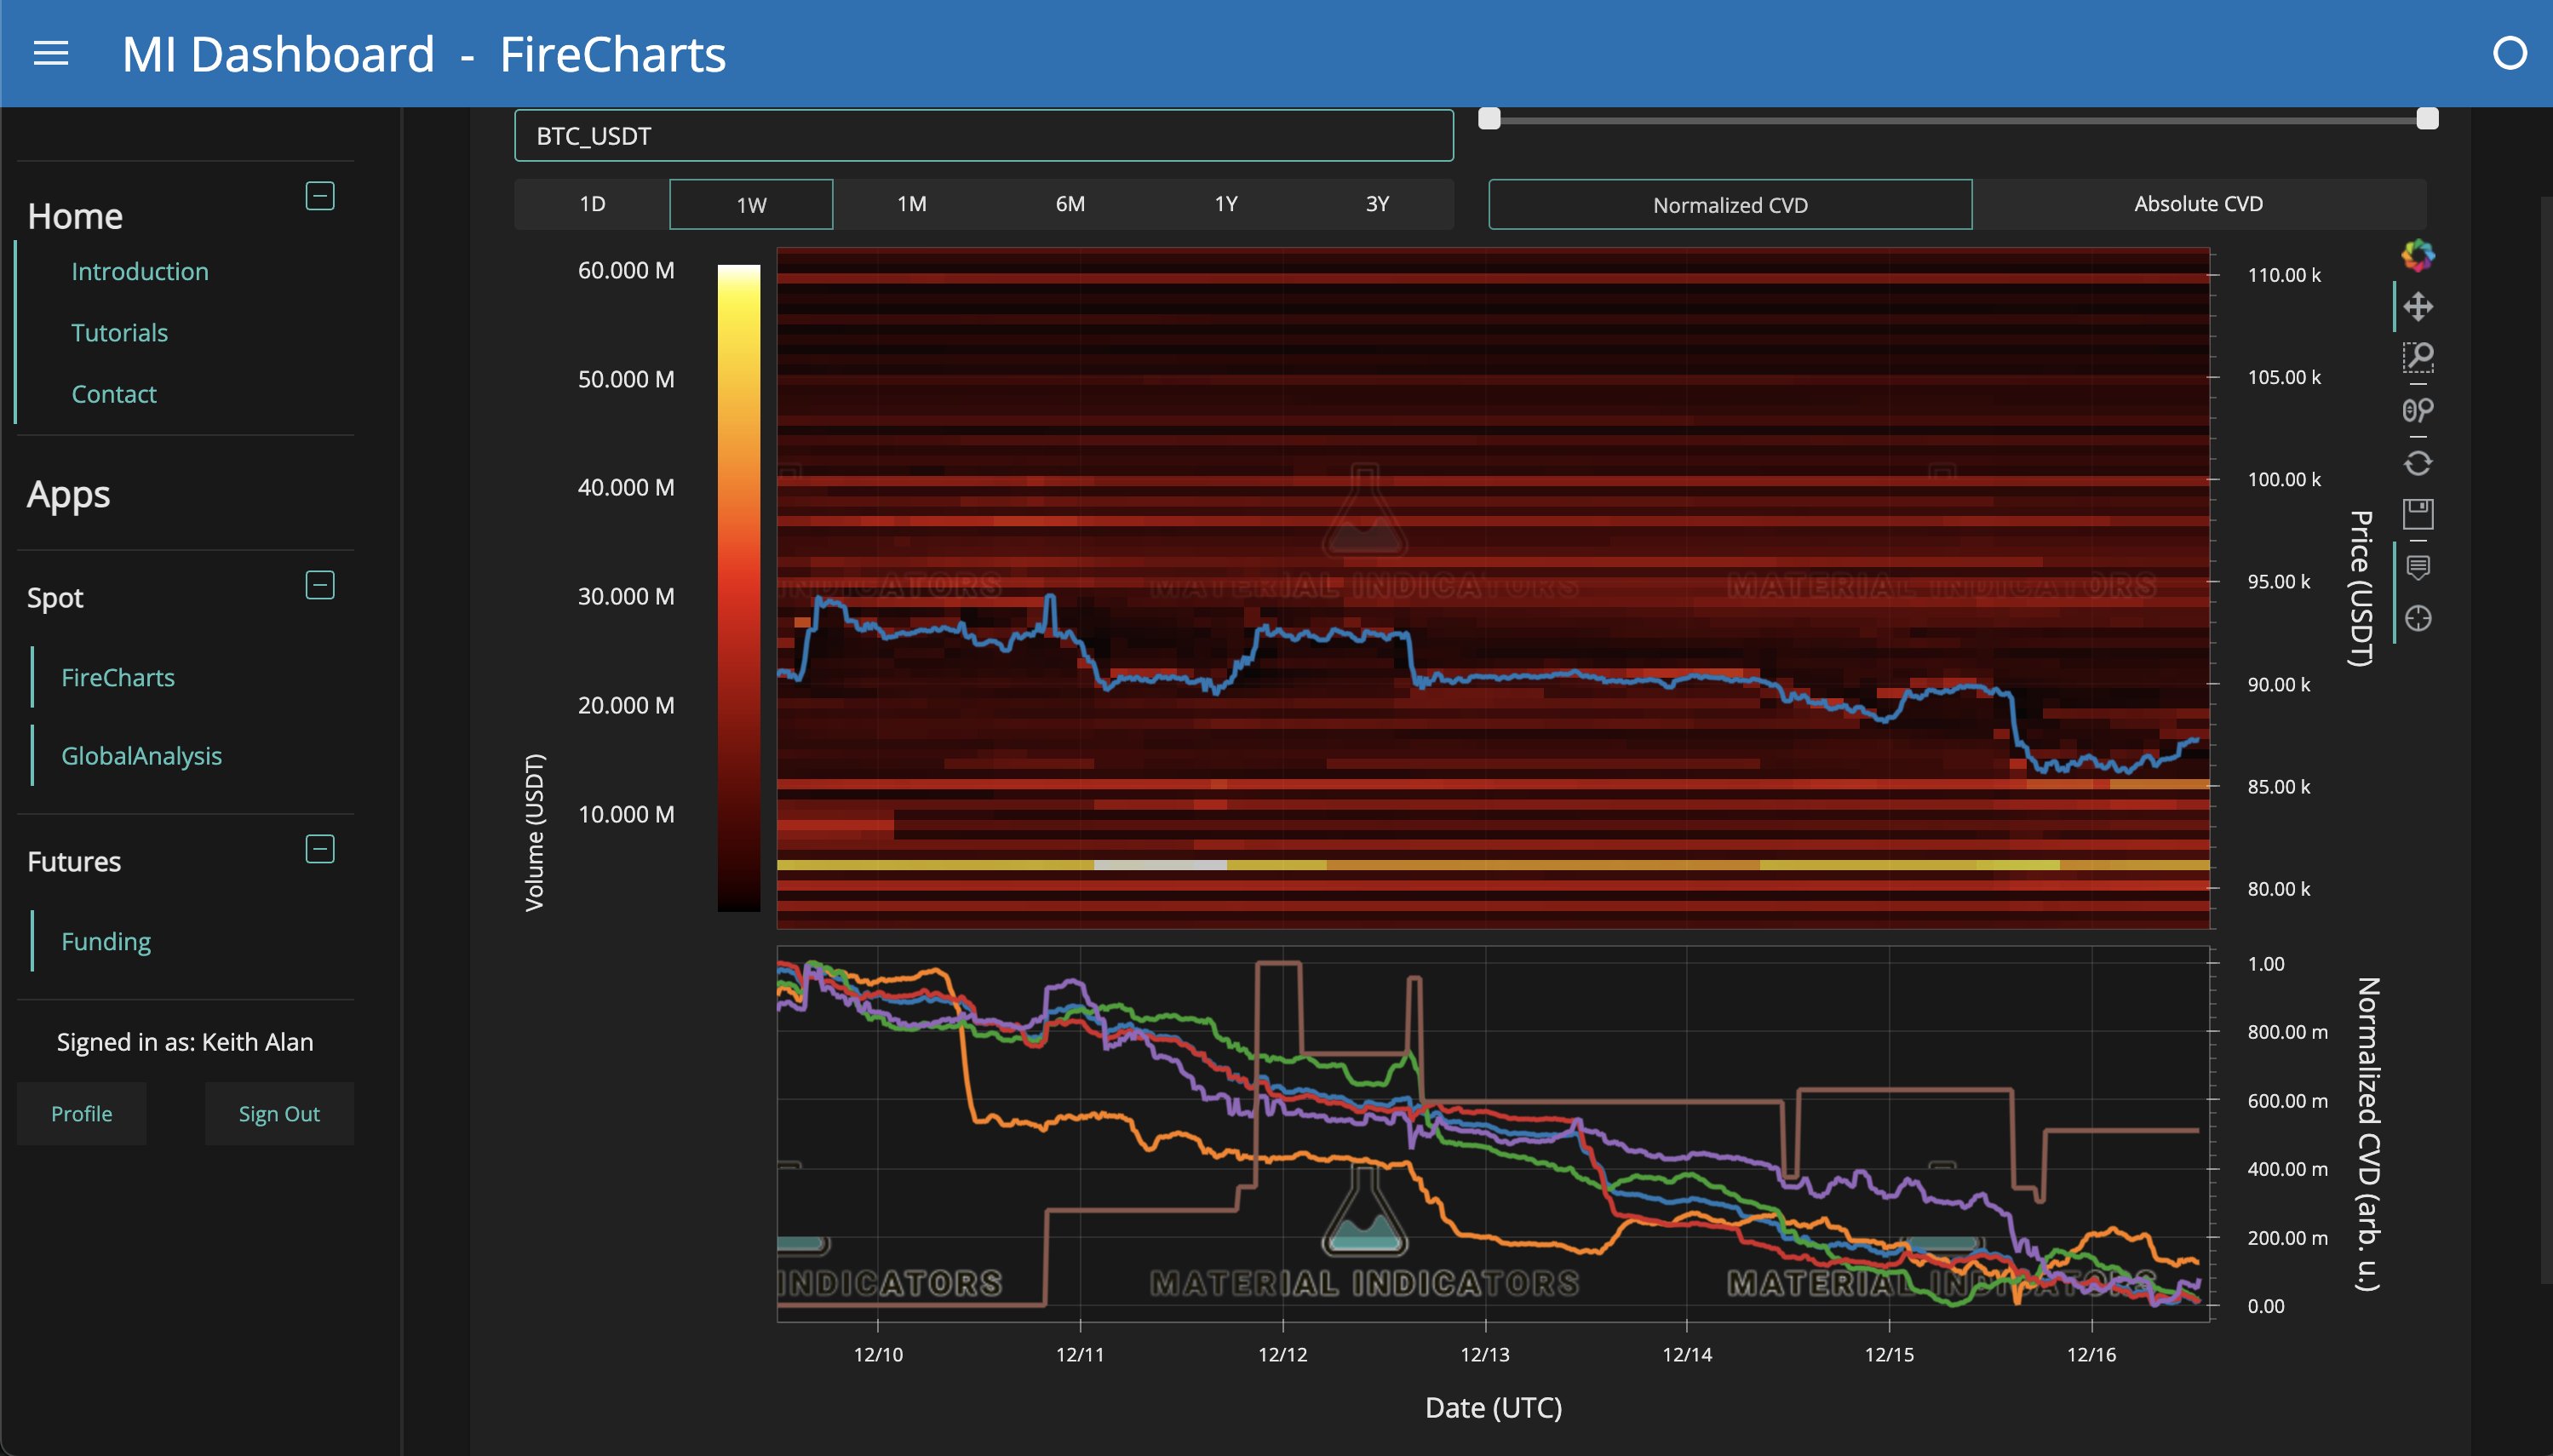
Material Indicators referenced the 100-week simple moving average (SMA) as important support, currently at $84,646.
“Both concentrations of liquidity could be considered guardrails ahead of today’s economic data,” it added.
That data provided mixed signals for risk-asset traders. US unemployment came in above expectations at 4.6%, its highest level since the third quarter of 2021.
At the same time, the economy added around 14,000 more jobs than anticipated in November, giving conflicting signals over labor-market robustness.
“The labor market is still weakening,” trading resource The Kobeissi Letter nonetheless concluded in an X response.
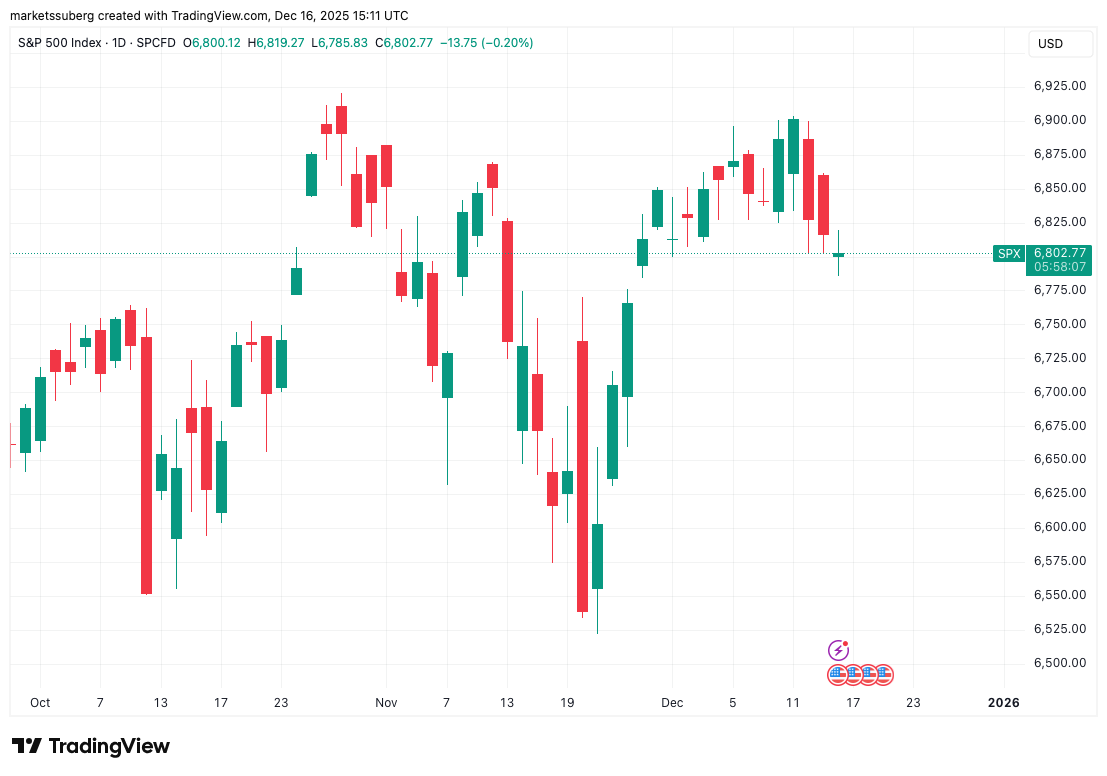
Stocks also attempted to recoup losses at the open, with the S&P 500 seeking a green candle after a rocky start to the week.
As Cointelegraph reported, the week’s main macro data event, the November print of the Consumer Price Index (CPI), was due Thursday.
”Thin air” toward six figures
Bitcoin traders, meanwhile, felt little relief as the price stayed tied to liquidity clusters.
Related: Bitcoin long-term holder supply hits 8-month lows: Bullish or bearish?
“This reaction to me is sub par and i would think if we dropped below to $84,000 region, we would get a better reaction for a long off the liquidity there,” Crypto Tony told X followers.
Trader Kay said that BTC/USD was about to see its “final leg down” from its all-time high in October.
“The dump from $126K to $100K was due to OGs selling. The dump from $100K to $85K was due to ETFs selling,” he argued.
“Now, the next dump will be due to retail selling and that’s when a rally starts. IMO, a dump to sweep the April lows before a rally above $100K in Q1 2026.”
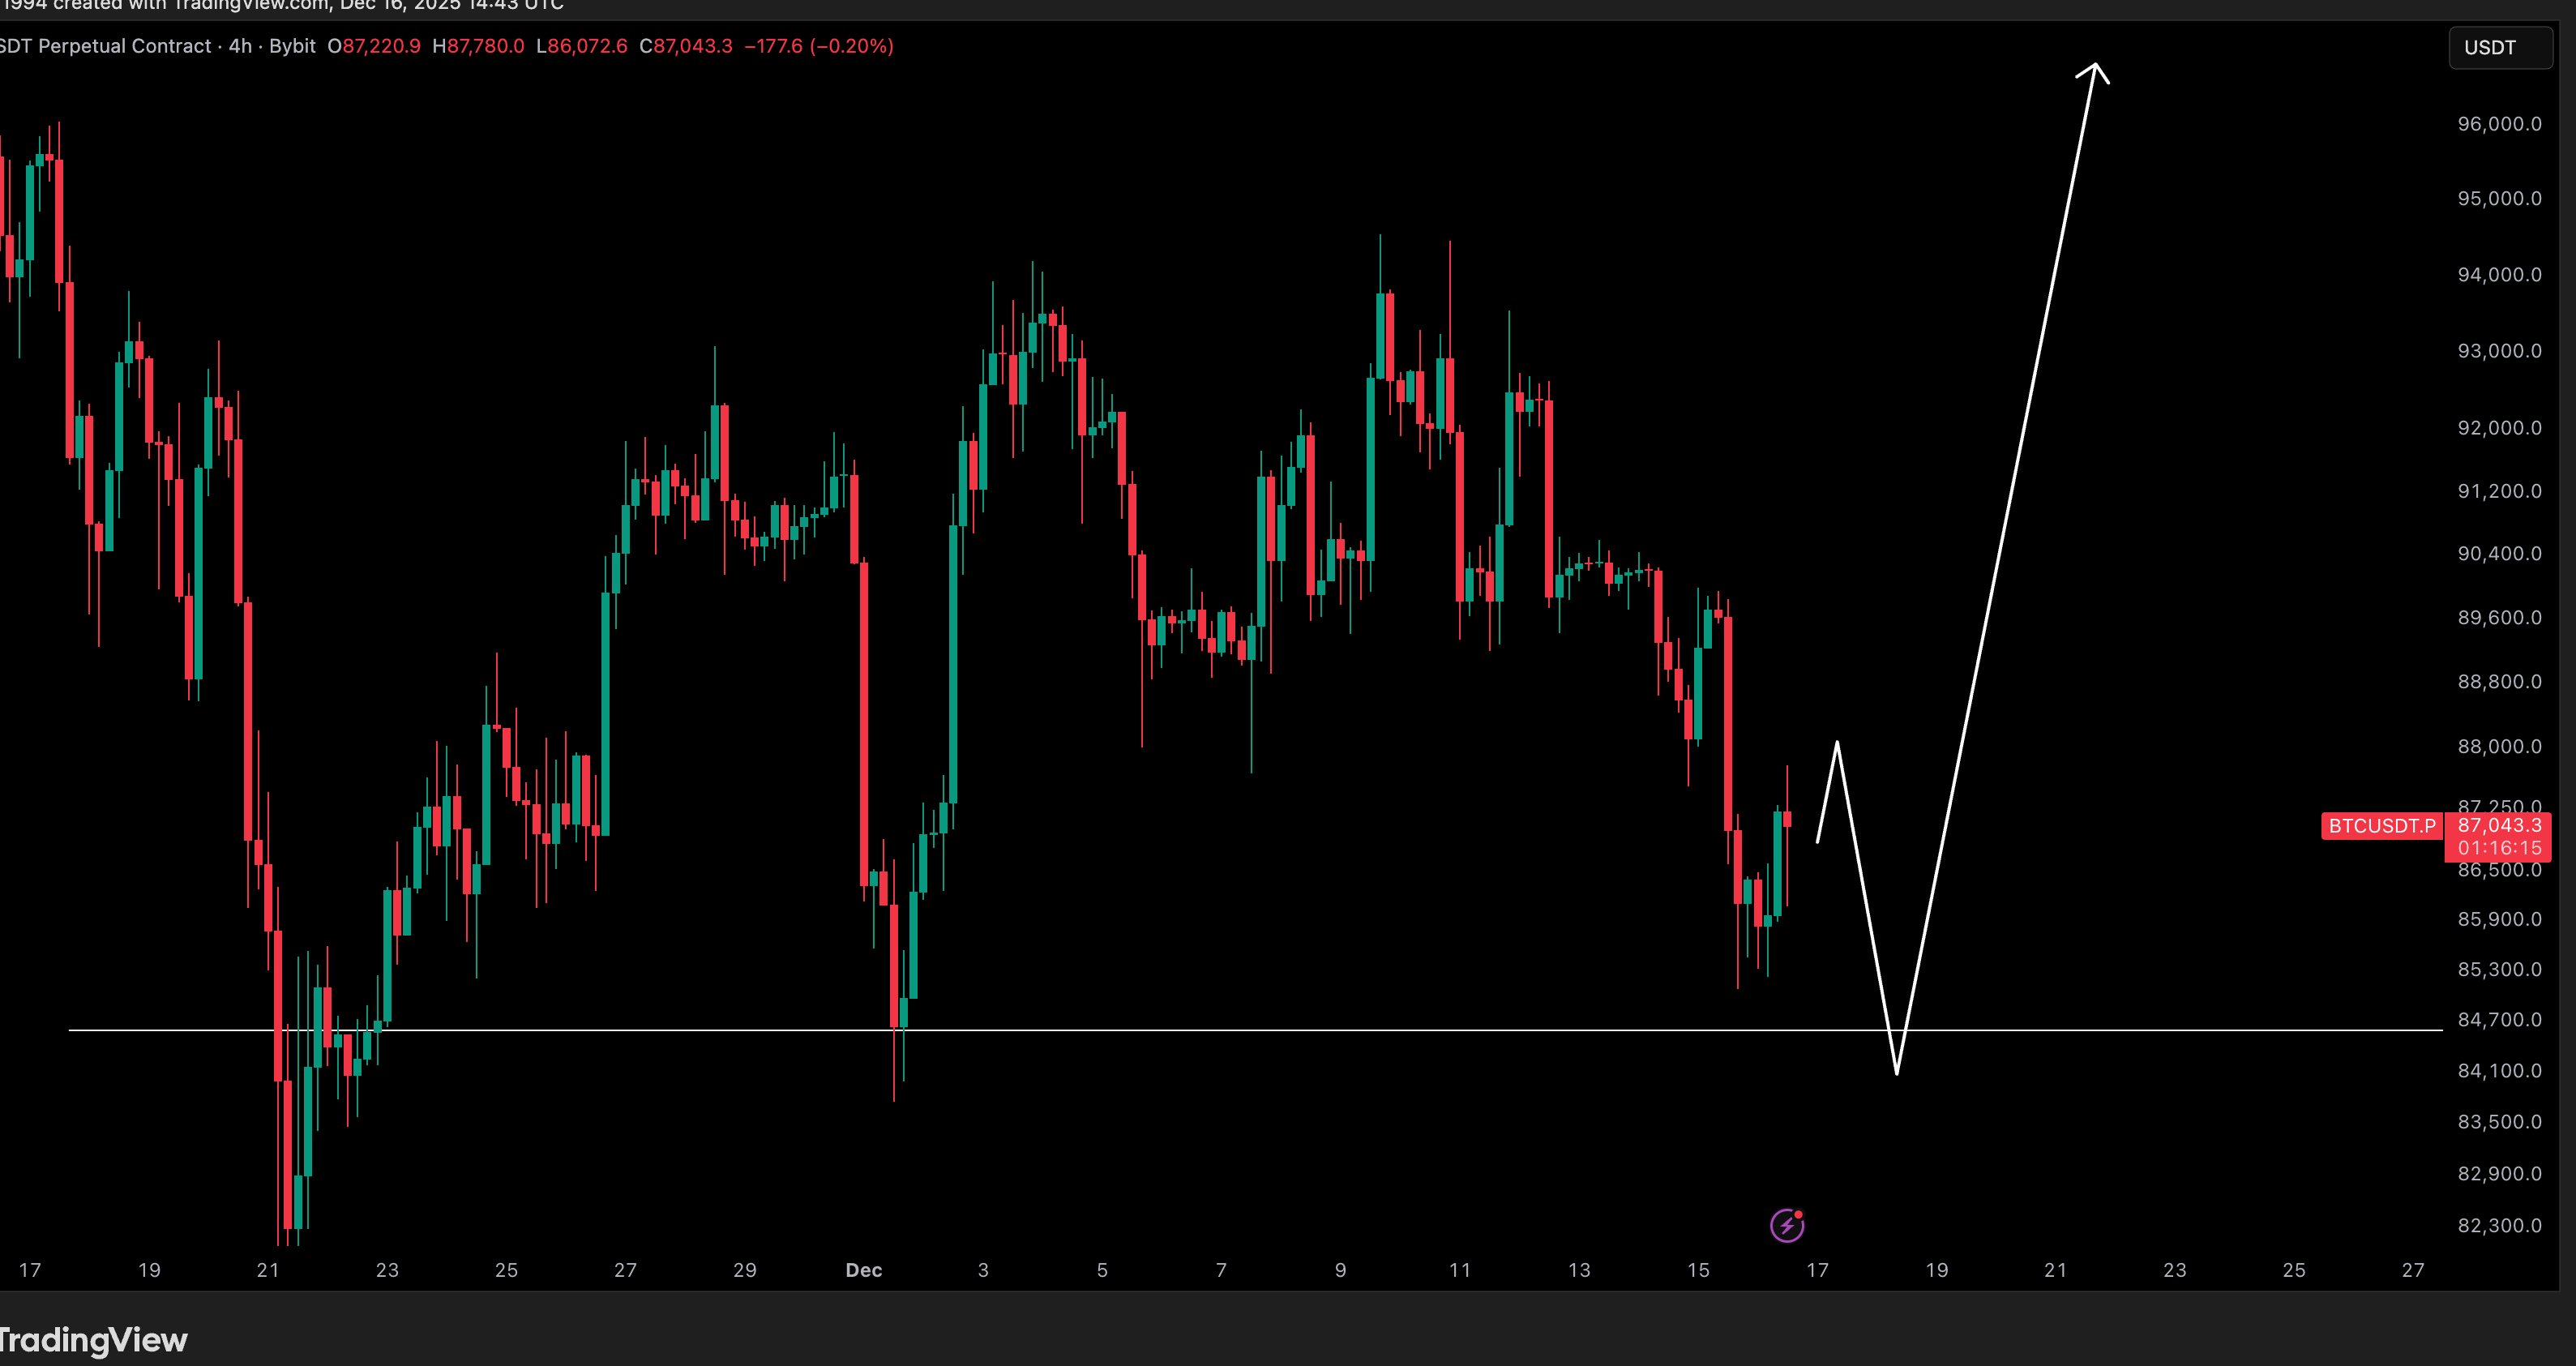
Continuing the hopeful tone, commentator exitpump eyed “huge” bid liquidity further toward the $80,000 mark, as well as a potential clear run to $95,000 in the event of a resistance breakout.
$BTC Huge passive demand on spot orderbooks is still there, some large asks have been added at 88k, above that level thin air till 95K pic.twitter.com/L6bW2LIqr4
— exitpump (@exitpumpBTC) December 16, 2025
This article does not contain investment advice or recommendations. Every investment and trading move involves risk, and readers should conduct their own research when making a decision. While we strive to provide accurate and timely information, Cointelegraph does not guarantee the accuracy, completeness, or reliability of any information in this article. This article may contain forward-looking statements that are subject to risks and uncertainties. Cointelegraph will not be liable for any loss or damage arising from your reliance on this information.


