Shiba Inu (SHIB) has recently surged past a key bullish trendline, sparking fresh optimism among traders and investors. This breakout marks a significant shift in momentum that could pave the way for a potential rally toward the $0.00002045 level. As the market eyes this potential rally, all attention turns to whether SHIB can sustain its upward trajectory and reach this ambitious target, or will the bears step in to stall the run?
This article provides an in-depth technical analysis of Shiba Inu’s recent breakout above the trendline, evaluating whether this could trigger a rally toward the $0.00002045 target. Additionally, it will explore potential price reactions once SHIB approaches this critical level.
In the last 24 hours, Shiba Inu has gained over a 6% increase, reaching approximately $0.00001519. The crypto asset’s market capitalization has surpassed $8.9 billion, with trading volume exceeding $311 million. Over this period, the market cap has increased by 6.59%, while trading volume has surged by 85.23%.
Trendline Breakout: A Bullish Signal For Shiba Inu?
Following the breakout above the trendline, SHIB’s price has maintained its bullish momentum, consistently trading above the 100-day Simple Moving Average (SMA) on the 4-hour chart. This sustained positive sentiment reflects strong upward momentum, signaling that the bulls are firmly in control and could push the price toward the next significant resistance level at $0.00002045.
Also, the Relative Strength Index (RSI) indicator is currently at 73% showing that Shiba Inu is in an overbought territory. A sustained overbought condition signals strong buying pressure suggesting that bullish momentum remains robust in the market.
On the daily chart, although SHIB is experiencing a short-term pullback, it is attempting to move toward the 100-day SMA following a successful breakout above the bearish trendline. The appearance of a bullish momentum candlestick on the previous day indicates a strong bullish sentiment, which could drive the cryptocurrency towards further gains.
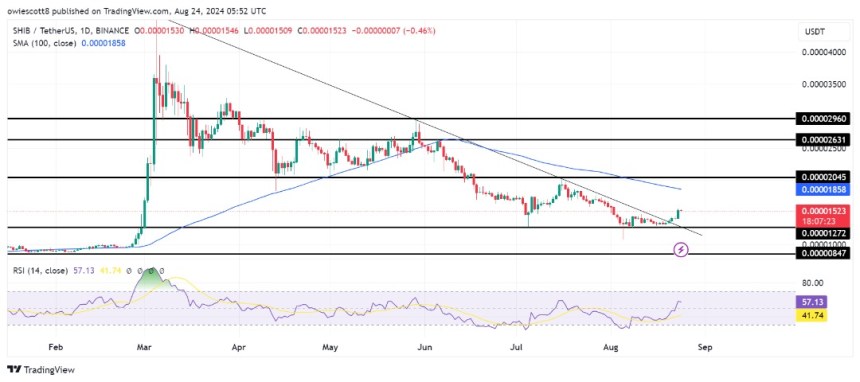
Finally, the 1-day RSI indicates that SHIB’s bullish momentum is strengthening, with the signal line moving toward the overbought region after recently crossing above 50%. The upward movement in the RSI suggests intensifying buying pressure and growing bullish sentiment for the asset.
Potential Market Reactions: What Happens If SHIB Hits $0.00002045?
Potential price reactions when Shiba Inu reaches $0.00002045 include a breakout above this level or a potential rebound.
If Shiba Inu breaks above the $0.00002045 level, it could signal the beginning of a sustained bullish rally toward the $0.00002631 resistance level. A successful break above this level could propel the asset toward the next resistance at $0.00002960, with the potential for even higher gains.
However, if the cryptocurrency encounters a rebound at the $0.00002045 resistance level, the price may retrace to its previous low of $0.00001272. When SHIB breaks below this support, it could indicate an additional downside momentum, potentially driving the asset toward the $0.00000847 mark and possibly lower levels.

Featured image from Unsplash, chart from Tradingview.com


