Chainlink (LINK) returned to mimic the broader crypto market downtrend as its price fell alongside top coins Bitcoin (BTC) and Ether (ETH) on Nov. 8.
LINK plunged by as much as 10% into the day to reach $8. While BTC and ETH slipped by approximately 6.5% and 9%. That contrasts with the trend witnessed on Nov. 7, wherein LINK rallied 14% to $9.25, its three-month high, while BTC and ETH dropped 1.5% and 0.5%, respectively.
Overall, on a week-to-date timeframe, Chainlink has outperformed both Bitcoin and Ethereum.
What’s making Chainlink stronger
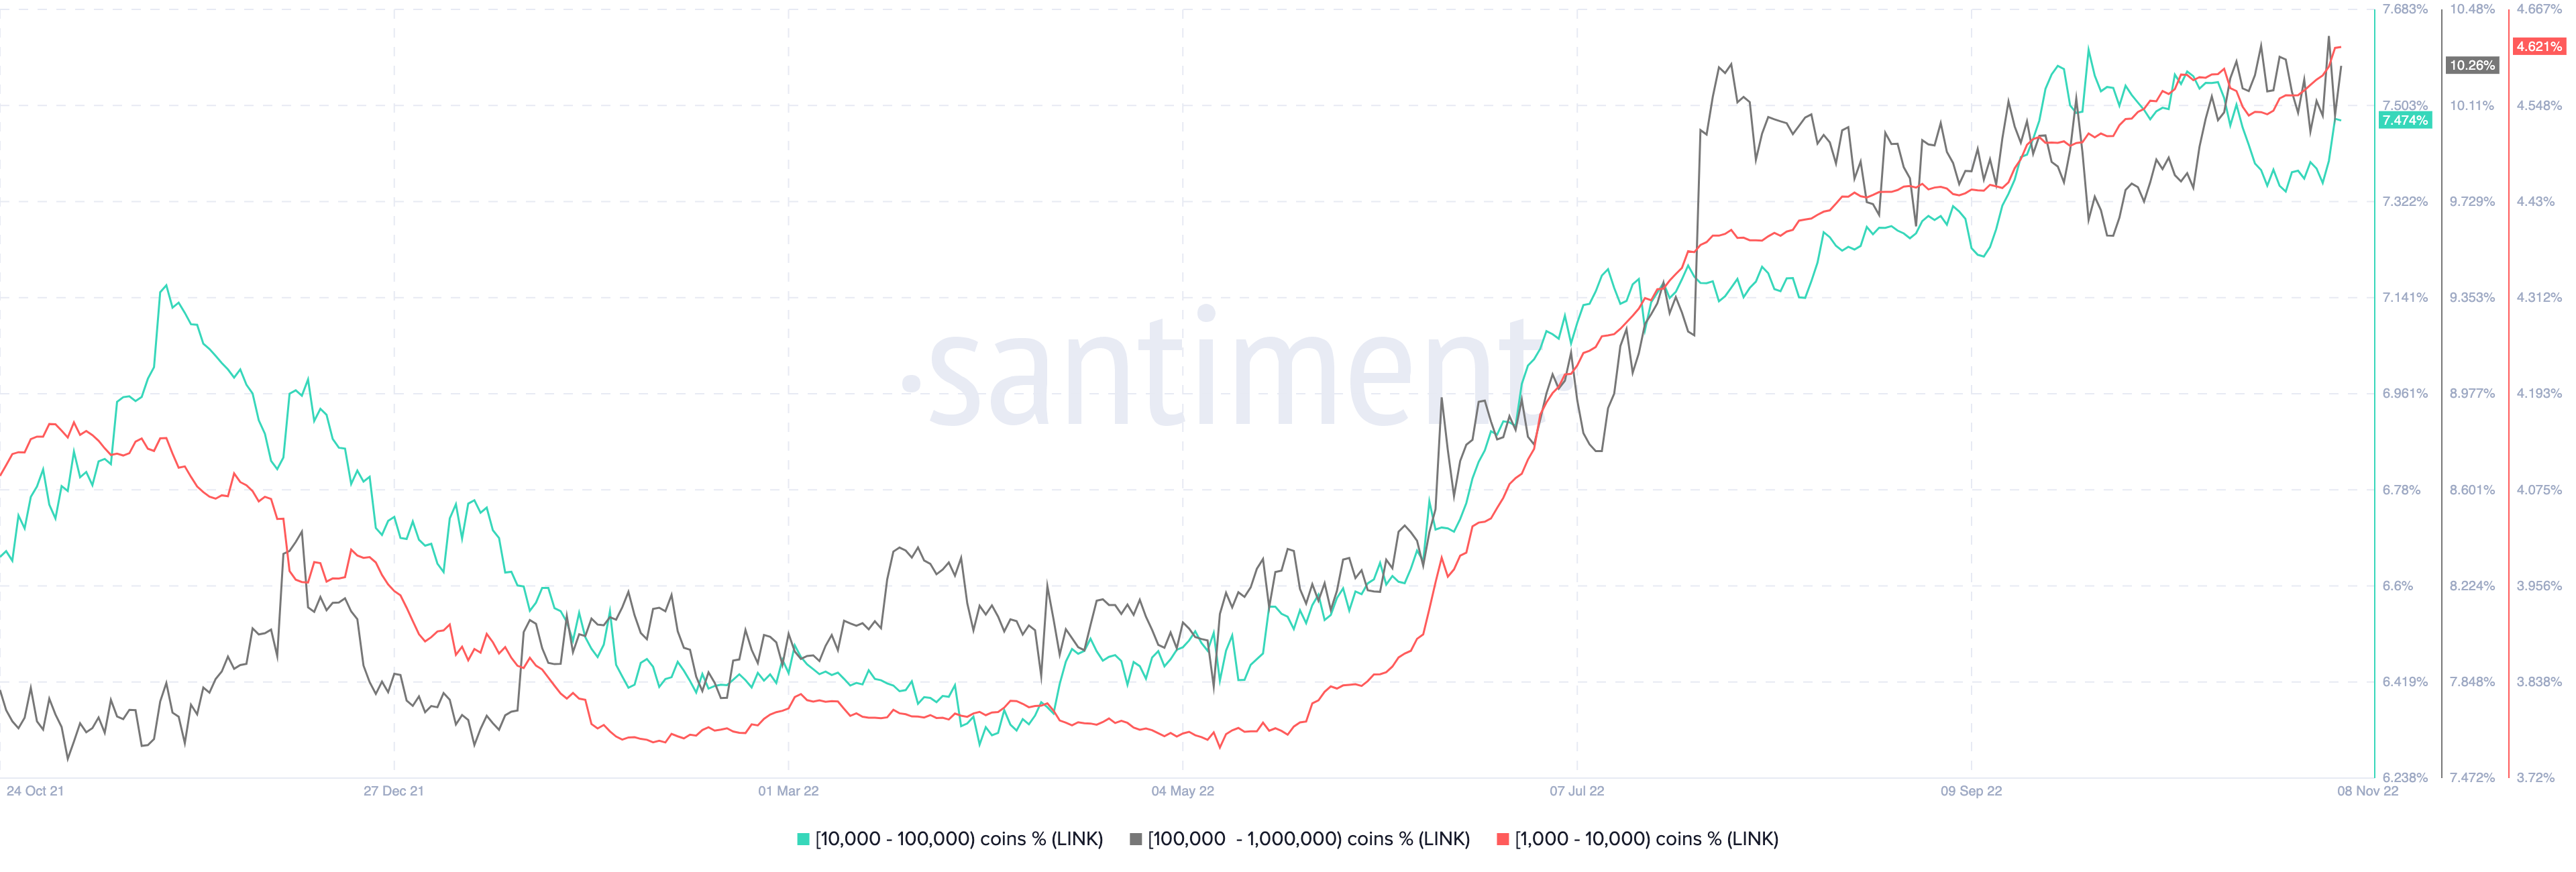
LINK’s price has rebounded by nearly 75% after bottoming out at $5.29 in May. Notably, the Chainlink token’s recovery rally has coincided with a persistent increase in the supply held by its whales (entities that hold at least 1,000 LINK).
The Chainlink supply percentage held by addresses with a balance between 1,000 LINK and 1 million LINK has risen to nearly 23% in November from 18.2% in May, according to Santiment data. This indicates that rich investors may have been the key players behind the LINK price recovery.

Interestingly, the LINK accumulation trend is rising in the days leading up to the launch of “Chainlink Staking.”
Chainlink Co-founder Sergey Nazarov announced at SmartCon 2022 that their long-awaited LINK staking reward function would go live in December. In addition, the project’s official website confirms that it would enable “eligible community members” to stake LINK into its pool in December.
The LINK staking service will be opened for the public in the same month, with the initial annual percentage yield set at 5%. The event has started drawing speculations about increased demand for the Chainlink tokens by the end of 2022.
LINK appears to have benefited in the short-term due to the euphoria around the Chainlink Staking function, given other coins have tumbled in unison in response to the crypto hedge fund Alameda Research’s insolvency rumors.
#Chainlink spiked all the way above $9.20 for the first time since August 13th, a ~3 month high despite very volatile markets. This rise has been supported by the largest amount of active $LINK addresses in 5 weeks, and traders are longing aggressively. https://t.co/ZxsZnveURm pic.twitter.com/lia6XAgSar
— Santiment (@santimentfeed) November 8, 2022
A 25% correction setup is still in play
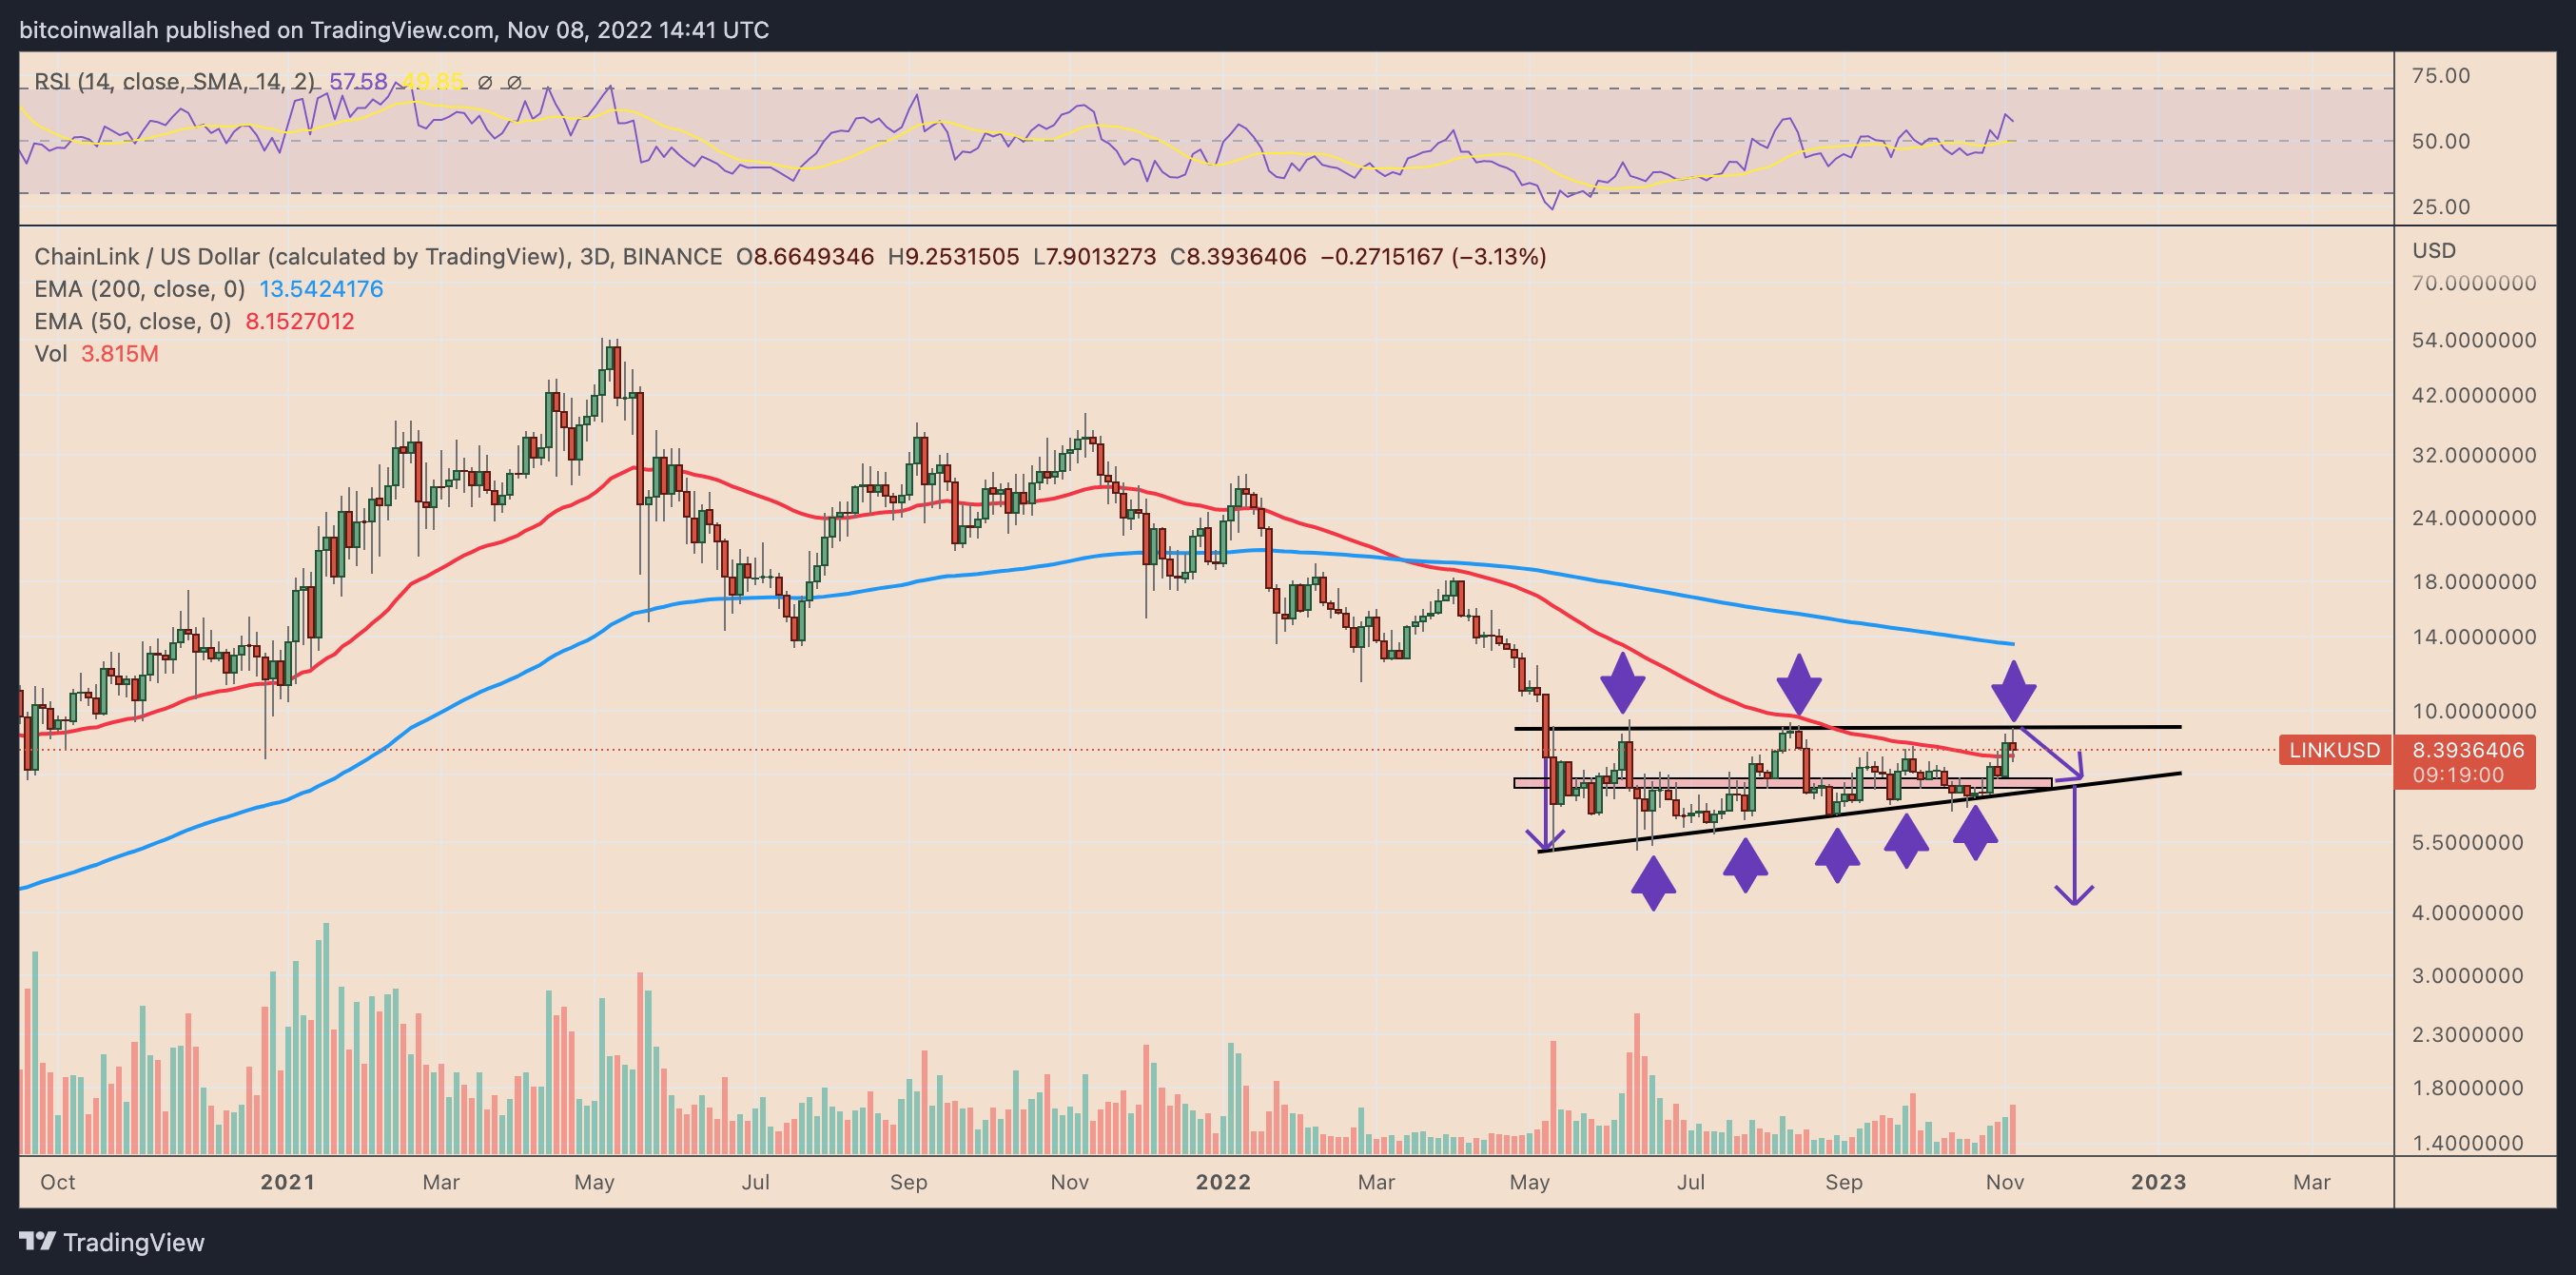
From a technical perspective, LINK’s recovery rally since May has been confined inside an ascending triangle range.
Related: Bitcoin heads to US midterms as research says dollar ‘closing in’ on a market top
Ascending Triangles are continuation patterns, meaning they typically send the price in the direction of its previous trend after a consolidation period. LINK was trending downward before it formed its ascending triangle.
The token’s likelihood of continuing its downtrend and reaching its profit target stands at 44%, per the observation of ascending triangles by veteran investor Thomas Bulkowski. The profit target is measured after adding the maximum triangle height to its breakdown point, as illustrated below.

That puts LINK en route to around $4.15 by December 2022, down about 50% from today’s price.
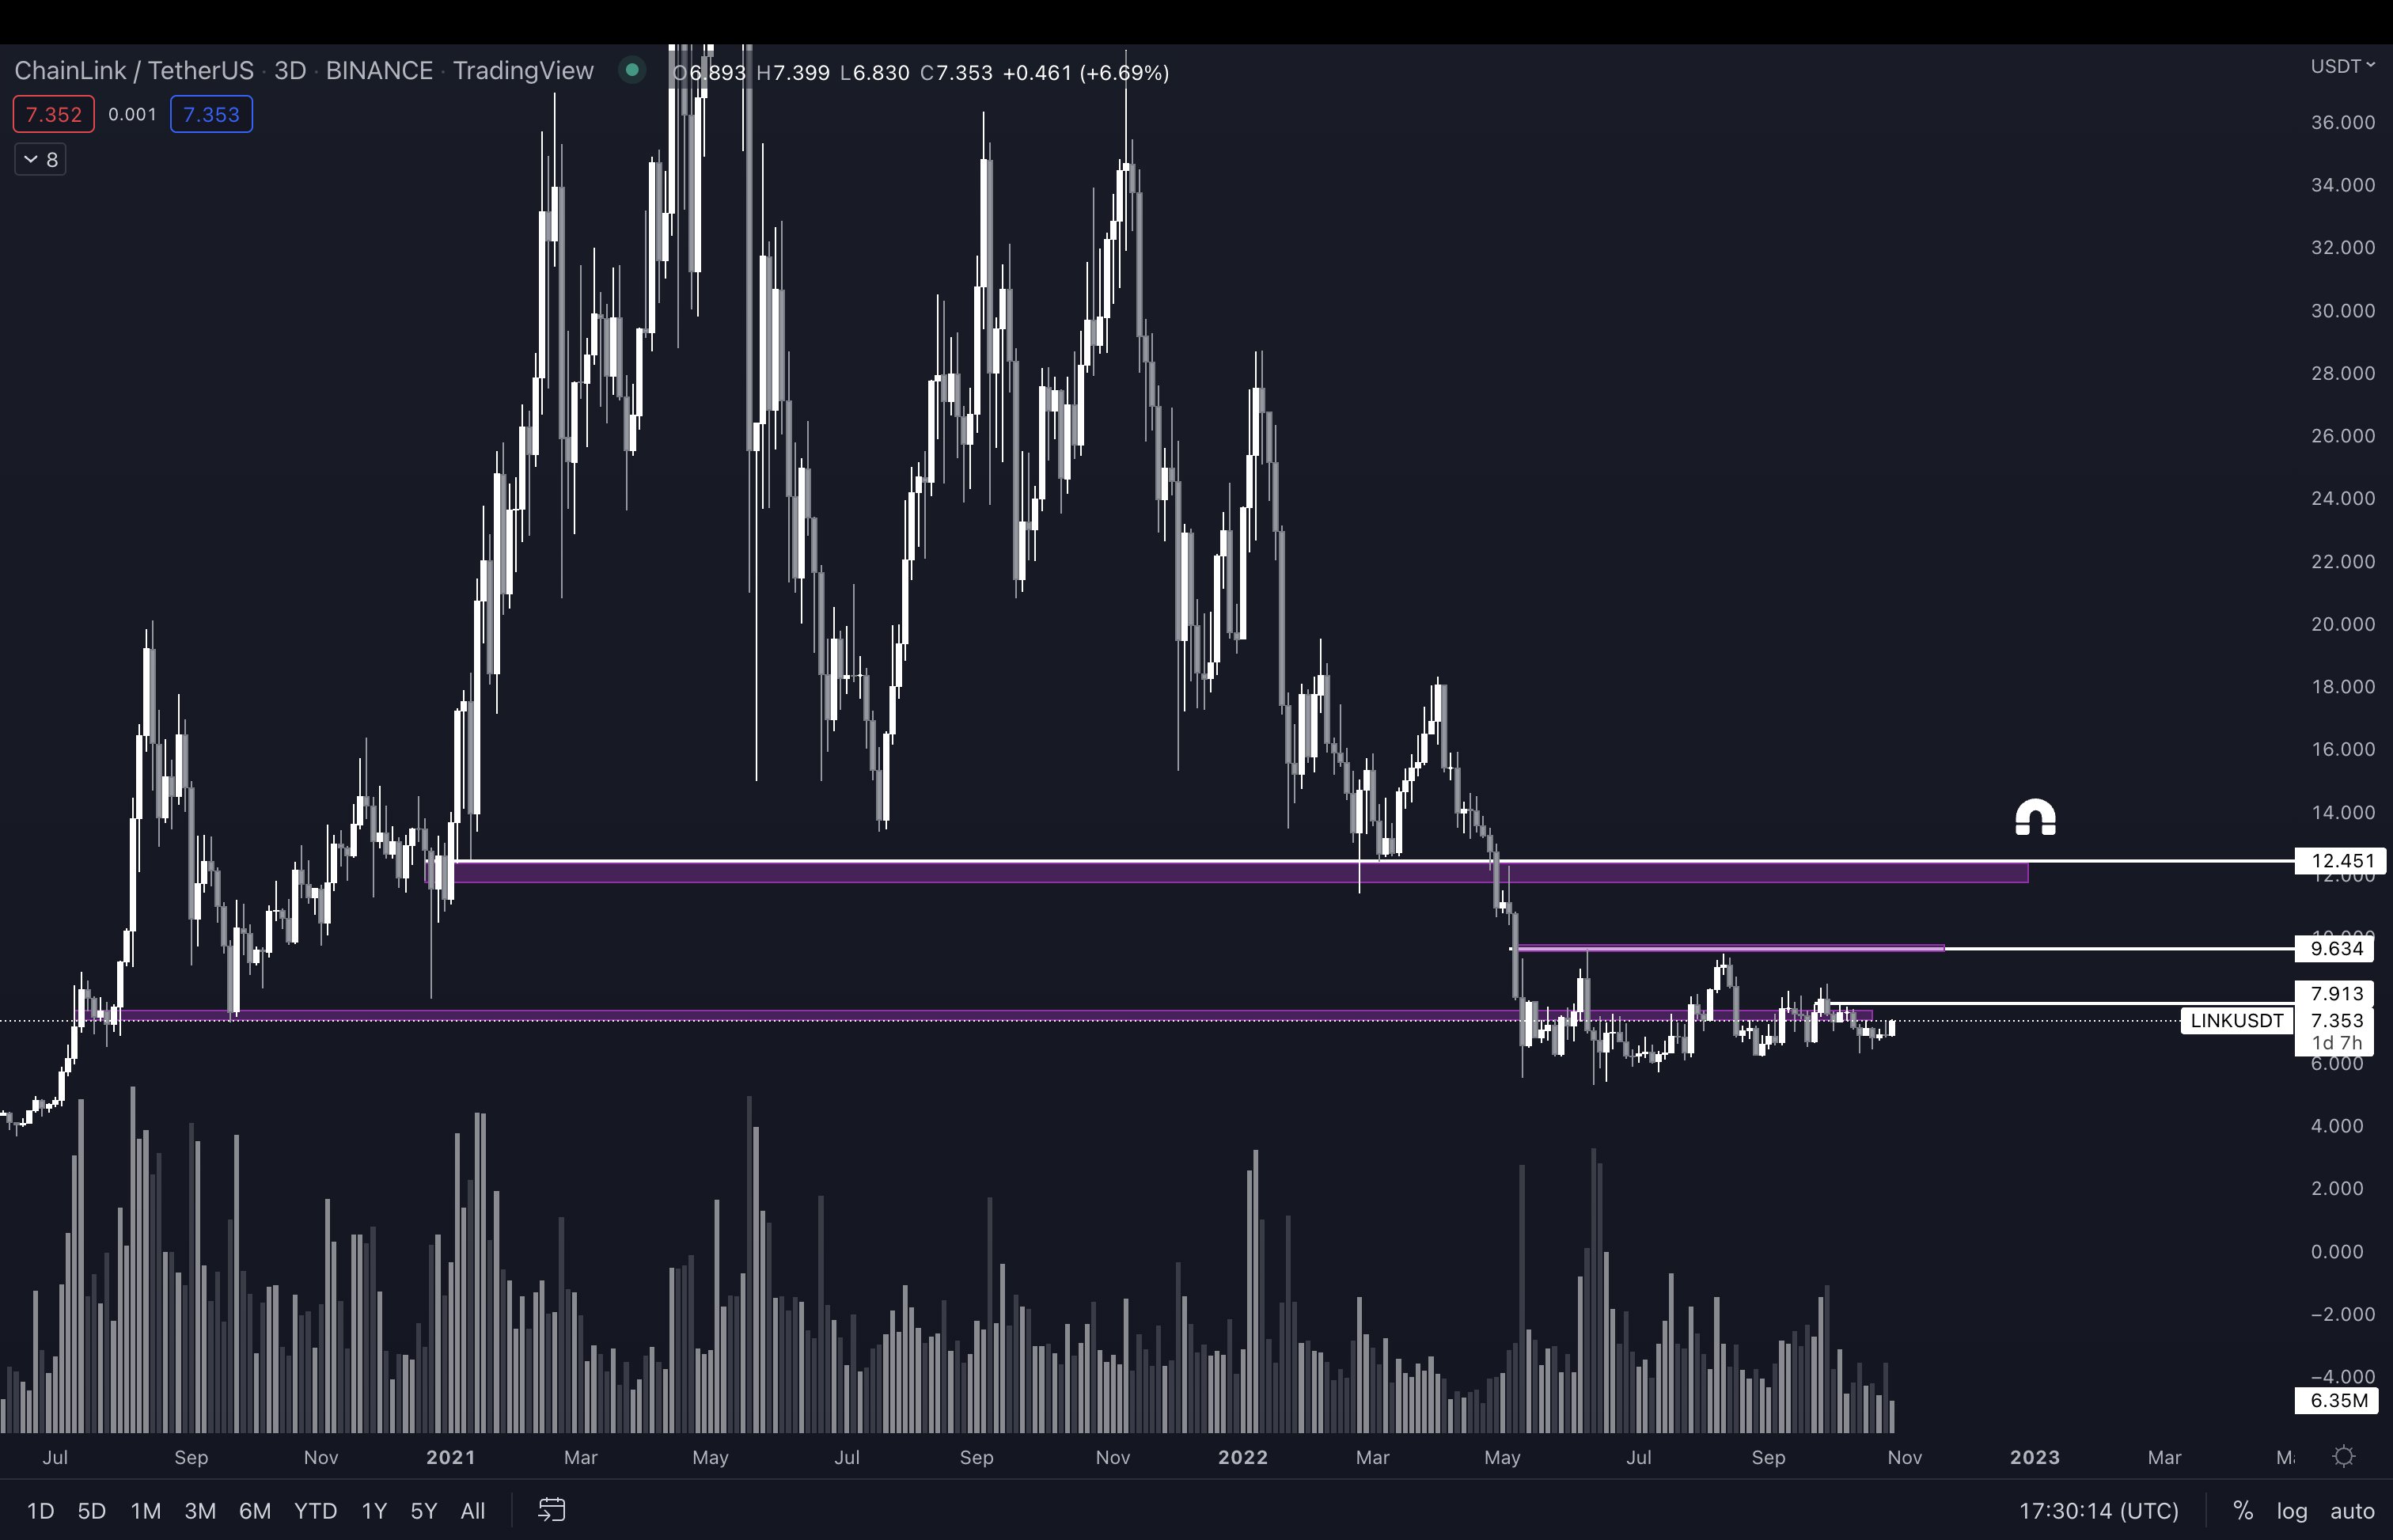
Conversely, independent market analyst Pentoshi anticipates LINK to reach $12 in the same period, given the token has been floating above the same support that was instrumental in sending its price to a record high in May 2021.

“While people are quiet on it now. I don’t think that will be the case 3-4 weeks from now,” Pentoshi said.
The views and opinions expressed here are solely those of the author and do not necessarily reflect the views of Cointelegraph.com. Every investment and trading move involves risk, you should conduct your own research when making a decision.


