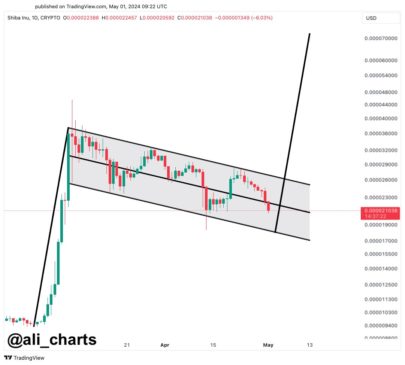
An analyst explained how Shiba Inu could be heading towards a massive rally based on a bull flag pattern that forms in its daily chart.
Shiba Inu Has Been Consolidating Inside A Bull Flag Recently
In a new post on X, analyst Ali has discussed about a bull flag that has recently appeared in the daily price of Shiba Inu. The bull flag is a pattern in technical analysis (TA) that, as its name suggests, is shaped like a flag on a pole.
The pattern forms when an uptrend is followed by a period of consolidation inside a parallel channel toward the downward direction. The starting uptrend makes up for the pole, while the channel acts as the flag.
Like other TA patterns, the consolidation channel or flag here comprises two parallel lines. The upper level connects the price tops, while the lower one joins the bottoms.
When the asset retests either of these levels, it’s probable to undergo a reversal, with the upper line of the channel acting as a point of resistance and the lower one as support.
A break above the resistance line is considered a bullish signal for the price. The uptrend resulting from such a break may be the same length as the flag’s pole.
On the other hand, a drop below the flag (that is, a breakdown of support) invalidates the formation and may even suggest the takeover of bearish momentum for the asset.
Similar to the bull flag, there is also the bear flag in TA, which works much in the same way, except that it occurs during a downtrend (with the flag signifying consolidation towards the upside following a downward pole).
Now, here is the chart shared by Ali that shows the bull flag pattern Shiba Inu has potentially been forming on its daily price recently:
The formation that the memecoin's price has been displaying during the last few weeks | Source: @ali_charts on X
From the graph, it’s clear that the Shiba Inu 1-day price has been consolidating inside what appears to be a bull flag pattern channel in the past few weeks.
“I’m placing buy orders around $0.000018343, aiming for a bullish breakout that sends $SHIB to $0.000072323,” says the analyst. The former level is about where SHIB should meet the flag’s support next if it continues in its current trajectory, while the latter target is based on the height of the pole.
A run to the bullish target of $0.000072323 would imply a rally of more than 244% from the current spot price of the cryptocurrency, while from the lower support of $0.000018343, any such surge would correspond to a growth of over 294%.
It remains to be seen whether Shiba Inu will show a break above this bull flag pattern and, if it does, whether the price will benefit from bullish effects.
SHIB Price
At the time of writing, Shiba Inu is trading around $0.00002110, down more than 18% over the past week.
Looks like the price of the coin has been heading down over the last few days | Source: SHIBUSD on TradingView
Featured image from Traxer on Unsplash.com, charts from TradingView.com
Disclaimer: The article is provided for educational purposes only. It does not represent the opinions of NewsBTC on whether to buy, sell or hold any investments and naturally investing carries risks. You are advised to conduct your own research before making any investment decisions. Use information provided on this website entirely at your own risk.


