
The weekly chart for Dogecoin shows a signal that could be of greater significance due to its rarity. Crypto analyst Cryptollica pointed to DOGE’s weekly RSI tagging roughly 33.6 and claimed that level has shown up only four times in 11 years. “DOGE WEEKLY RSI. 4 times in 11 years ..,” he posted.
What This Means For The Dogecoin Price
DOGE, for context, was trading around $0.129 at the time of writing, down roughly mid-single digits on the day.
The hook is simple: a weekly RSI that low usually means sellers have been in control for a while — and on a weekly timeframe, that kind of pressure tends to carry more weight than intraday noise. This isn’t “RSI brushed 30 on a 15-minute candle.” It’s slower, heavier, and tied to the bigger trend.
Still, it’s not quite as plug-and-play as the screenshot makes it look. Cryptollica’s point is that the same zone showed up around (1) early May 2015, (2) March 2020, (3) mid-June 2022, and (4) now. The post is the spark; what traders actually care about is what happened next. And this is where Dogecoin’s history gets… very Dogecoin.
Related Reading
On May 6, 2015, DOGE was quoted around $0.000087. Beyond the price being basically dust, the backdrop was messy: weeks earlier, Dogecoin co-founder Jackson Palmer said he was stepping away from the crypto community, calling out what he described as a “toxic” culture.
The bounce didn’t show up on schedule. DOGE drifted for a long time, then later caught the 2017–18 mania, briefly touching $0.017 on Jan. 7, 2018. From roughly $0.000087, that’s about +19,000% to that local-cycle high — a good reminder that “oversold” on a weekly chart can show up early and still end up pointing the right way.
In mid-March 2020 (peak COVID panic), DOGE traded around $0.001537. When the panic eased and liquidity returned to markets, DOGE went on to print its next cycle top at $0.7316 on May 8, 2021.
That’s roughly +47,000% from the March 2020 level to the 2021 high. It’s also the stretch where DOGE stopped being “just” a joke coin and started behaving like a retail risk-on barometer — with Musk-era attention pouring gasoline on it.
By mid-June 2022, the bear-market washout was in full effect. DOGE was around $0.053. The recovery came in waves: a late-2022 pop tied to Musk/Twitter speculation and broader risk-on bursts, then a bigger 2024 meme-led rip.
Related Reading
By March 28, 2024, DOGE was back around $0.220 — roughly +315% from the June 2022 level to the next notable local high. Not 2021-level insanity, but still a real multi-x.
And now, as of Tuesday, Dec. 16, 2025, Dogecoin was changing hands around $0.129. The “signal” crowd will look at that weekly RSI print and argue the market is back in the same psychological neighborhood as those prior exhaustion points.
The bullish case writes itself: if this weekly RSI zone has tended to show up near seller fatigue in the past, then seeing it again could mean risk/reward is quietly shifting. Not a promise — more like a reason to stop ignoring DOGE and start watching it.
But RSI isn’t a timing tool. Oversold can stay oversold. Weekly signals can hang around, whip traders around, or get flattened if broader risk keeps leaking.
For now, it’s a setup, not an outcome. If DOGE starts reclaiming levels and holding them, the “rare signal” crowd will take the victory lap. If it keeps bleeding, this gets filed under interesting, early, and painful — like a lot of trading ideas.
At press time, DOGE traded at $0.12878.
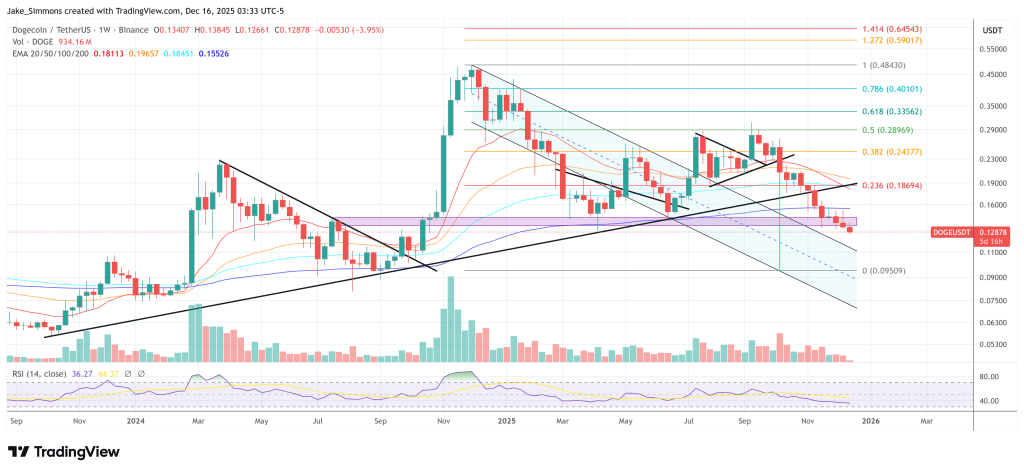
Featured image created with DALL.E, chart from TradingView.com


