
Crypto analyst Matt Hughes, who posts as “The Great Mattsby,” called the $0.11–$0.12 zone “incredible” risk/reward for Dogecoin in a Dec. 30 X post, sharing a weekly DOGE/USDT chart to argue the support is clearly defined. Another trader pushed back, saying traders may be “better off picking a good chart,” setting up a quick dispute over whether DOGE is a high-quality setup or just a cheap one.
The Best Risk/Reward Zone For Dogecoin
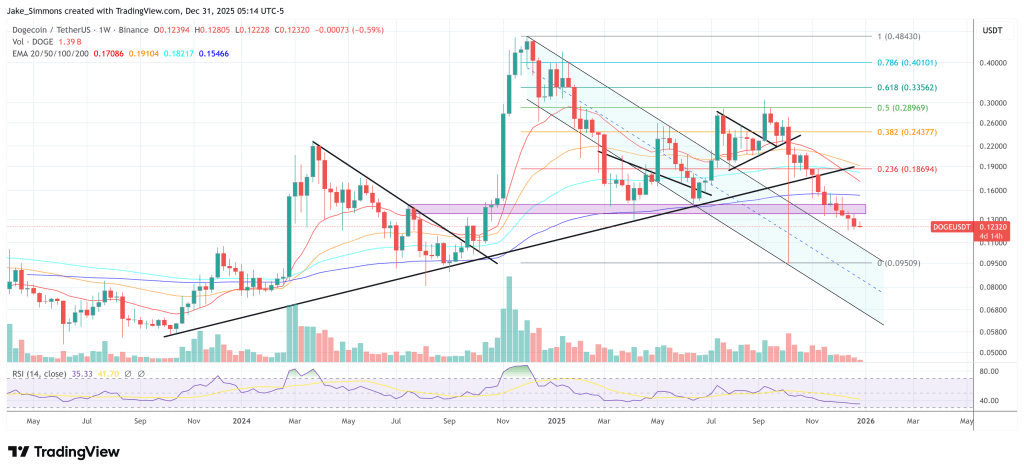
Hughes’ chart frames the $0.11–$0.12 area as a multi-year “line in the sand” on a weekly timeframe. On the right axis, DOGE is marked around $0.1236, sitting just above an orange horizontal band drawn slightly over $0.10. That horizontal is the zone Hughes is referring to, and it’s positioned where price has repeatedly based before, most notably during the long 2022–2023 trough, making it an obvious level for traders who want a nearby invalidation point.
He also overlays a linear-scale Gann Square with several rising diagonal guides. The most relevant one is a green, upward-sloping support line that runs under price from the early history of the chart into 2026; the current pullback is compressing into that rising support at roughly the same time it meets the $0.11–$0.12 horizontal. In practical terms, the setup Hughes is advertising is confluence: a horizontal demand zone meeting a long-term uptrend line, which can offer a relatively tight “risk” reference if the level fails.
Related Reading
“Risk/reward in the .11-.12 zone for $DOGE is incredible here,” Hughes wrote. “You can visualize support perfectly with this linear scale Gann Square below.”
Above spot, the next clearly marked band is a light-blue horizontal line around $0.23, which aligns with a region DOGE has churned around during prior rebounds. Higher up, Hughes’ chart marks additional overhead levels around $0.35 (green) and roughly $0.46 (teal), with a thick line near the upper end of the range around $0.58–$0.60.
If the $0.11–$0.12 zone holds, the chart implies the market has room to work back into those overhead shelves; if it doesn’t, the next visible guideposts on the chart are lower rising diagonals in the $0.05–$0.07 region, which would represent a materially deeper reset on the same multi-year structure.
On the macro backdrop, Hughes is clear: ” Crypto in 2026: The Bull Run That’ll Crush Fiat Dreams! While governments print money like it’s confetti and banks hoard your wealth, #Bitcoin hits $500K, #Ethereum flips entire industries, Solana owns speed, $XRP settles global finance overnight, and $DOGE moons harder than ever because the memes became money. Skeptics? You’re the same ones who called it a scam in 2021 because you bought the top. Time to wake up or get left in the dust.”
Related Reading
Renowned trader Cheds Trading (@BigCheds) challenged the trade premise bluntly: “Prob better off picking a good chart than throwing money at a bad one.” Hughes didn’t reject the critique; he acknowledged momentum can be easier elsewhere, but restated his preference for a defined downside at the levels he highlighted: “Yea you can ride the momentum better that way but I like the risk/reward in this zone for DOGE.”
Hughes’ post also landed alongside broader rotation chatter. He cited @MerlijnTrader approvingly in a separate message, echoing a sentiment-led thesis that altcoin turns often begin when positioning is defensive and conviction is thin. “Look at the wall street cheat sheet, man. We are in depression, right? Trot maps, emotion to price and it’s screaming maximum opportunity right now,” Merlijn said in a short video. “Just got to pick the right coins.”
Merlijn tied any rotation to bitcoin’s next resolution and emphasized how uncomfortable those early turns tend to feel. “Once Bitcoin resolves now, all stone bottom one, Bitcoin is weak, right? So they bought them on Bitcoin and stable and everyone has emotionally given up on everything else,” he said. “That’s how rotations are born really quietly, uncomfortably before conviction returns.”
For Dogecoin, Hughes’ chart reduces that broader debate to a single question: does the $0.11–$0.12 confluence area hold on the weekly, or does the market force traders to reassess risk further down the structure.
At press time, DOGE traded at $0.1232.
Featured image created with DALL.E, chart from TradingView.com


