The Dogecoin (DOGE) price stands at a critical juncture as technical analysts point toward a potentially significant breakout. Renowned crypto analyst Rekt Capital has identified a pivotal pattern on the DOGE/USD daily price chart, suggesting an imminent surge.
Will Dogecoin Price Confirm The Breakout Today?
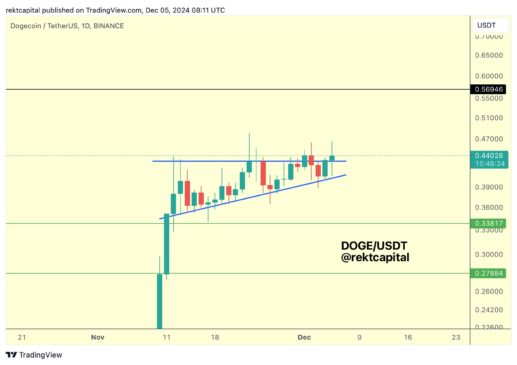
The daily chart of Dogecoin reveals an ascending triangle formation that has been developing over recent weeks. This pattern is typically considered a bullish continuation signal, characterized by a horizontal upper resistance line and a rising lower support line. The formation indicates accumulating buying pressure, as each price retracement becomes shallower—implying that bulls are willing to buy at higher lows.
The top horizontal line of the triangle sits at approximately $0.44, a level that has been tested multiple times and serves as a significant barrier for upward movement. The ascending support trendline begins around $0.34 and rises gently, forming the triangle’s lower boundary and highlighting increasing support levels.
Related Reading
Rekt Capital emphasizes the importance of the current price action, stating: “Dogecoin has followed every Bitcoin thus far. Now retesting the top of the Ascending Triangle as support. Successful retest here is crucial to precede a confirmed breakout.” If this retest solidifies the triangle’s upper resistance as a new support level, it could pave the way for a substantial price increase.
The potential breakout target can be calculated by measuring the maximum height of the triangle—from the base near $0.34 to the top at $0.44—and projecting it upwards from the breakout point. This suggests that Dogecoin could potentially reach or exceed the $0.54 mark.
Dogecoin Price Analysis (4-Hour Chart)
Another prominent crypto analyst, Satoshi Flipper (@SatoshiFlipper), has provided insights based on the 4-hour DOGE/USD chart. He notes: “DOGECOIN/usdt 4 hour: DOGE still consolidating, for almost 1 month now, but this flawless ascending channel is filling out nicely and the breakout is going to be EPIC, just wait.”
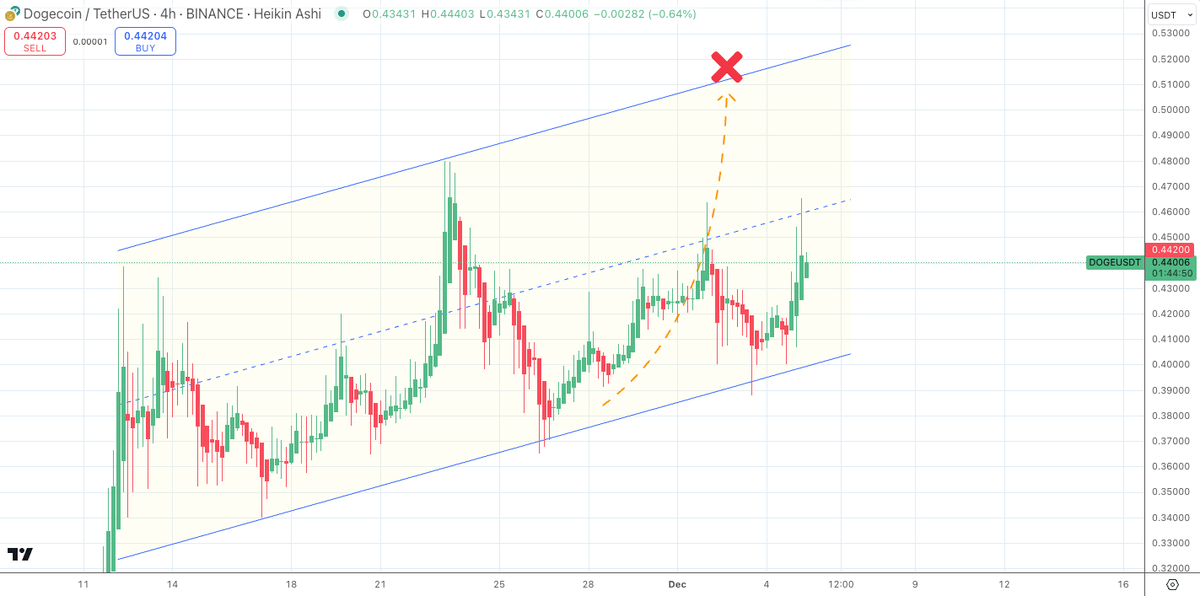
The chart illustrates an ascending channel pattern, characterized by two parallel upward-sloping lines containing the price action. This pattern is recognized as bullish, formed by higher lows and higher highs. The Dogecoin price has been oscillating between these lines, with the lower line acting as support and the upper line as resistance.
Related Reading
Currently, the price is nearing the midline of the channel, which provides significant resistance around $0.46. Key levels to watch include: The lower boundary support sits around $0.40. The upper boundary resistance is near $0.52, a potential catalyst for Dogecoin’s next major move.
The price target following an ascending channel breakout can be estimated by measuring the channel’s height at its widest part and extending that distance upward from the breakout point. This projection suggests that DOGE could rise towards $0.64.
Adding to the technical signals, there could be a major catalyst for DOGE price today, December 5th. As reported by NewsBTC, Elon Musk and Vivek Ramaswamy are set to address members of Congress. They are expected to present key proposals under the auspices of the Department of Government Efficiency (DOGE). This development could have a substantial impact on the Dogecoin price, as Elon Musk’s involvement with the memecoin has historically influenced market sentiment.
At press time, DOGE traded at $0.44.
Featured image created with DALL.E, chart from TradingView.com


