The Dogecoin price experienced a significant drop this week, sliding down more than 20% at times, from a peak of $0.1321 on Saturday to a low of $0.1026 by Tuesday. Despite this decline, on-chain metrics and expert analysis suggest a potentially bullish future for the popular meme coin.
Dogecoin Price Remains Bullish
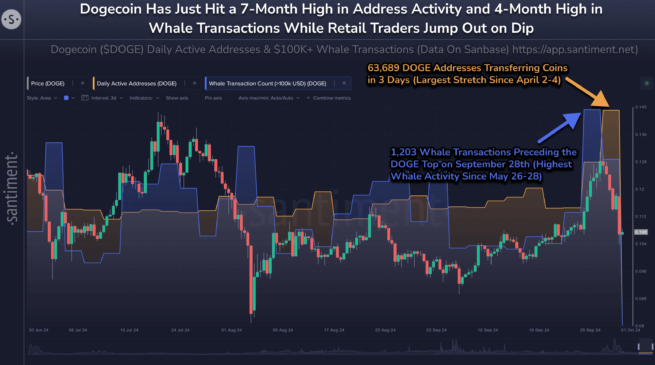
On-chain analytics firm Santiment has provided a detailed breakdown of Dogecoin’s activity via X today, indicating robust participation from large-scale holders, known as whales, in the cryptocurrency’s network. “Dogecoin has retraced -18% from its top back on Saturday. But on-chain activity indicates that whales may not be done with all the bullish momentum of crypto’s top meme coin. Though they took profit just before the top, their activity remains very high on DOGE’s network,” Santiment reported.
The analytics firm also highlighted a surge in Dogecoin’s network activity, noting that Dogecoin just hit a 7-month high in address activity and 4-month high in whale transactions while retail transactions jumped out on the price dip.
Related Reading
Over the last three days, 63,689 DOGE addresses have transferred coins which marks the largest stretch since April 2-4. Moreover, 1,203 whale transactions (>$100,000) preceded the local Dogecoin price top on September 28th. This marks the highest whale activity since May 26-28.
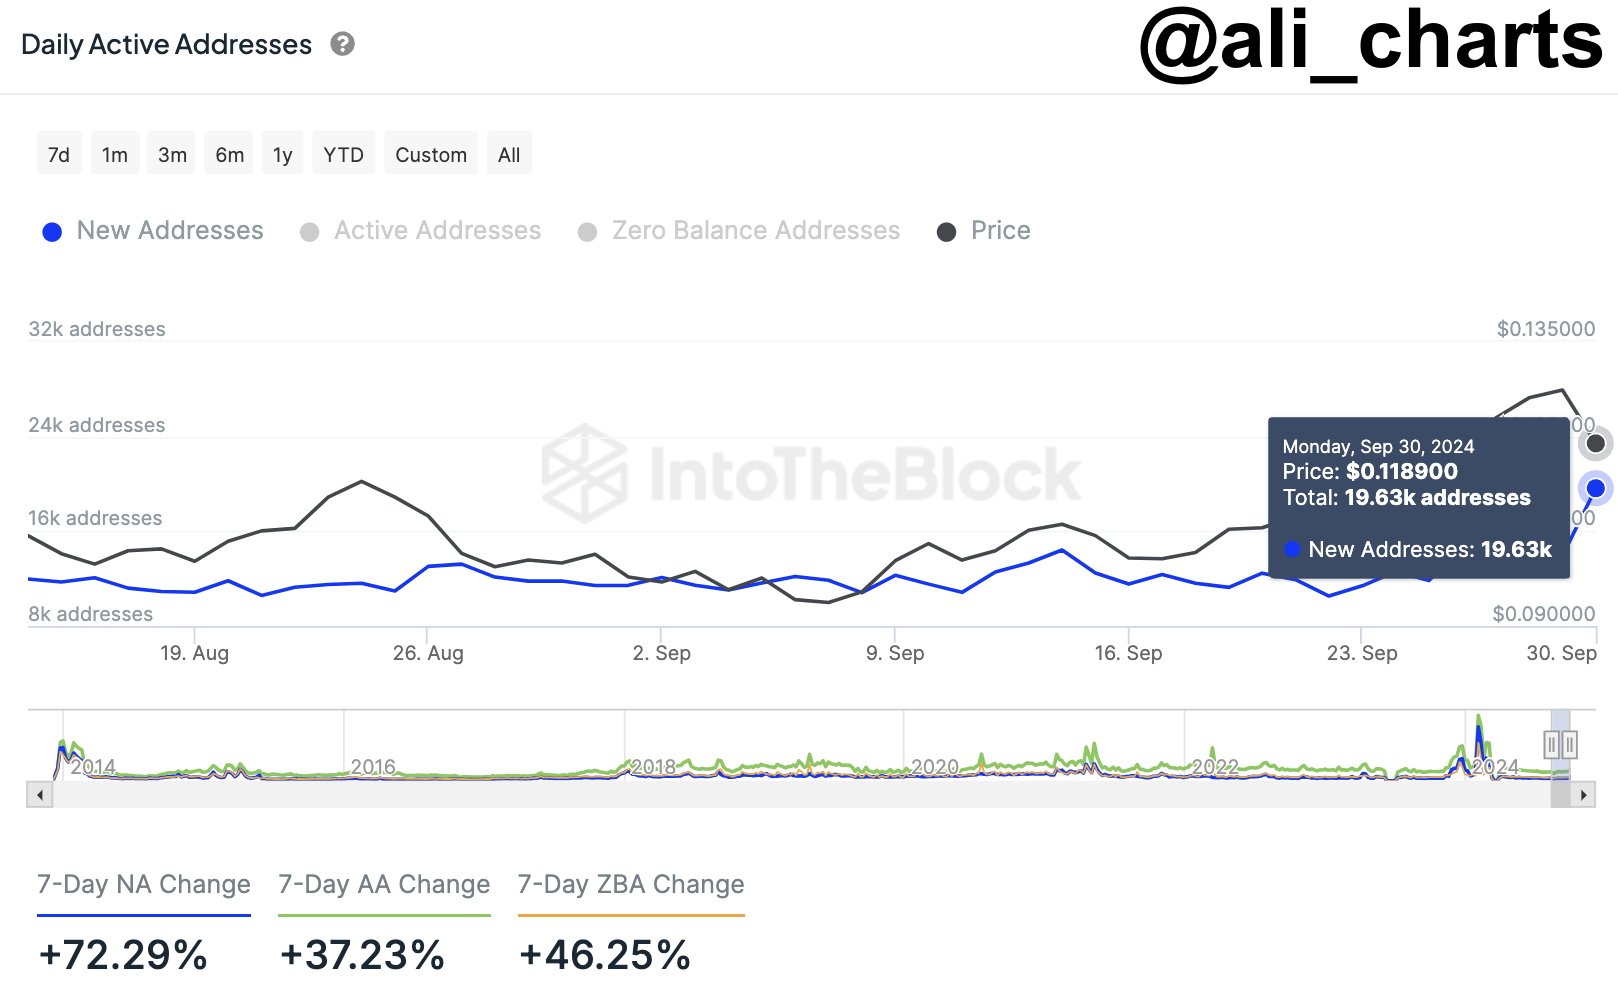
Crypto analyst Ali Martinez highlighted the massive activity within the network via X. Martinez stated: “The Dogecoin network is experiencing significant growth! Over the past week, there’s been a 72% increase in new DOGE addresses, and just yesterday alone, 19,630 new DOGE addresses were created!”
The crypto analyst further bolsters the bullish sentiment surrounding Dogecoin with a technical analysis. Martinez points out that DOGE might be nearing a MACD bullish crossover on the weekly chart, a potential indicator of upcoming price increases. “The last two times Dogecoin DOGE had a MACD bullish crossover on the weekly chart, it rallied 90% and 180%, respectively. A new MACD bullish crossover could be forming soon!” he explained.
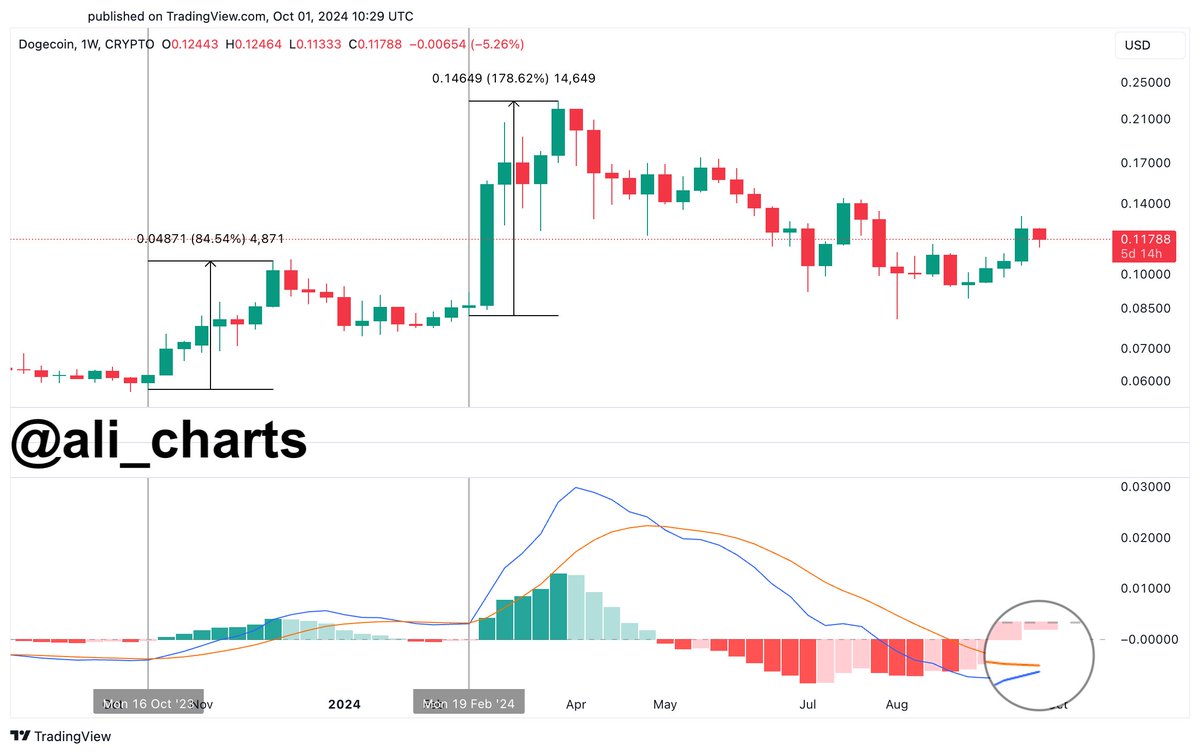
The MACD, or Moving Average Convergence Divergence, is a crucial tool in technical analysis. It consists of two lines: the MACD line, which is the difference between the 26-period and 12-period exponential moving averages (EMAs), and the signal line, which is the 9-period EMA of the MACD line. A bullish crossover, where the MACD line crosses above the signal line, typically signals a shift from a bearish to a bullish market trend, often interpreted as a buy signal.
Related Reading
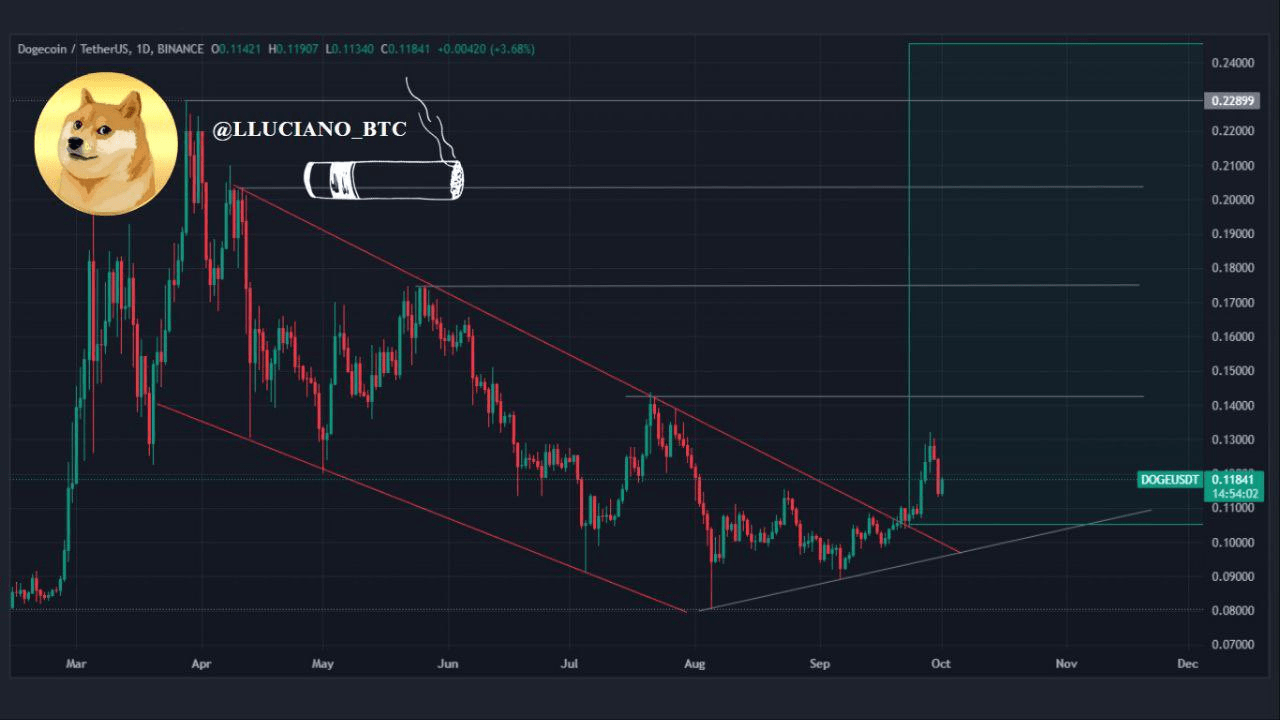
Another renowned crypto analyst, Luciano, has pointed to a breakout from a descending channel on the daily chart. He advises his 2.2 million followers on X: “DOGE has had a decent run in recent times and looks like this will continue. In my opinion dips are for buying and DOGE will have a spectacular season this cycle. DYOR – NAFA”
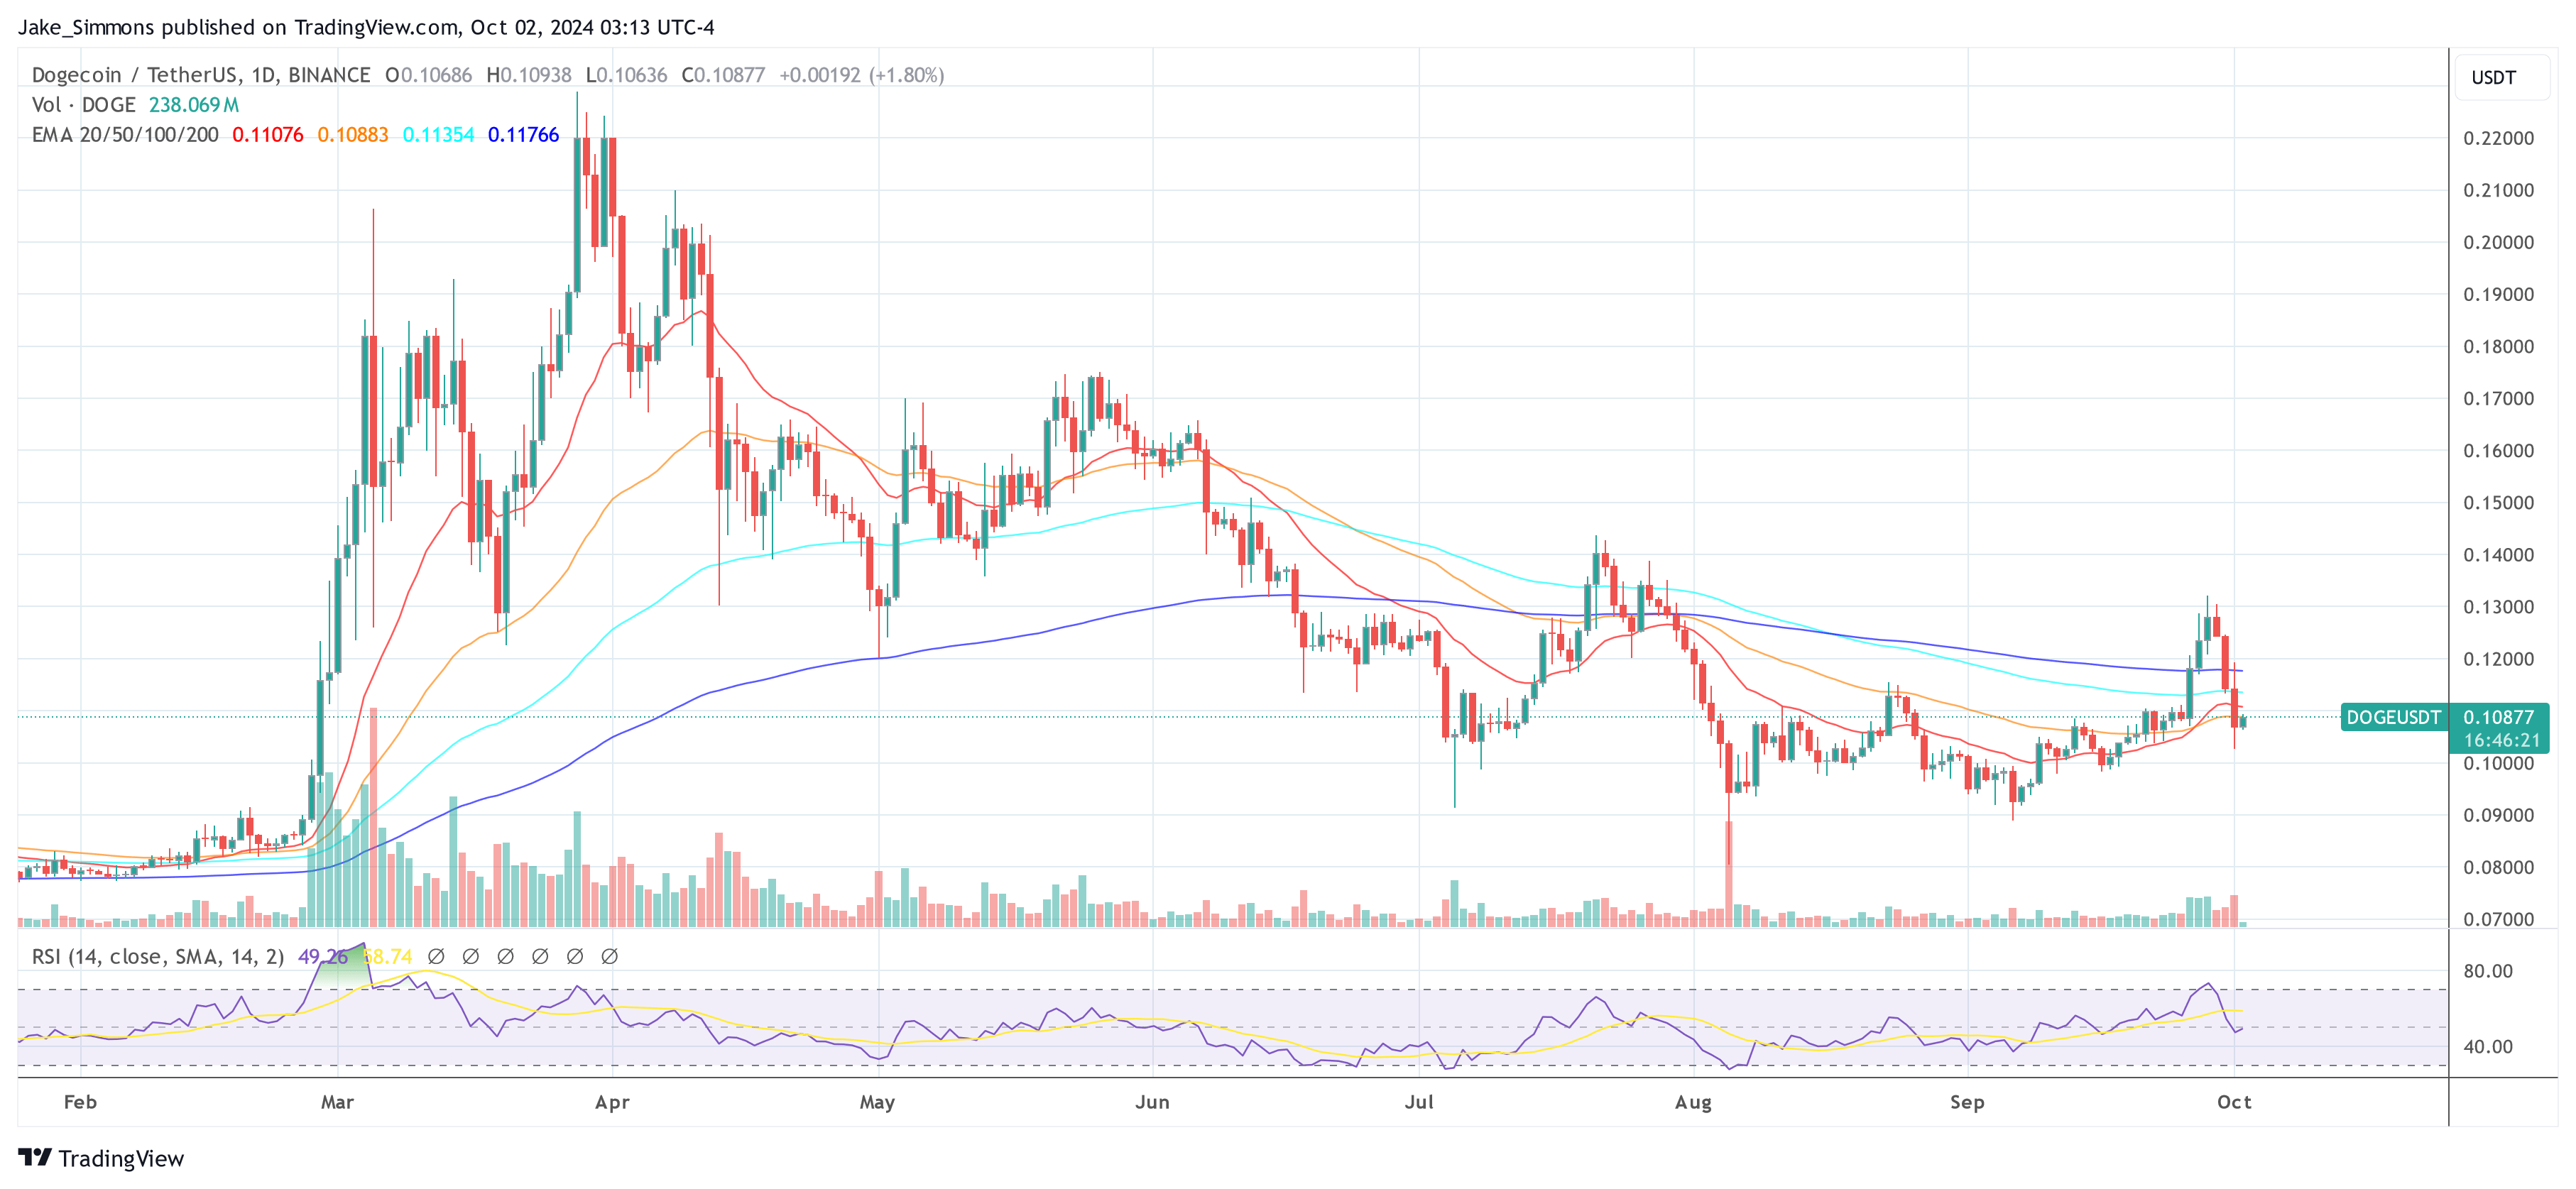
At press time, DOGE traded at $0.1087.
Featured image created with DALL.E, chart from TradingView.com


