The largest cryptocurrency by market cap, Bitcoin (BTC), dropped after a prolonged period of consolidation around the $29,000 mark. The failure to sustain this level has resulted in a decline to $26,000.
Interestingly, Bitcoin’s recent reversal has coincided with speculations of an imminent bull run, with many believing that the cryptocurrency winter is over and that lower price levels will not be revisited.
Nonetheless, this sentiment shifted on July 14th when the US Dollar Index (DXY) initiated a robust rally, surging from 99 points to its current level of 103.
As the DXY began its ascent, Bitcoin’s trajectory turned downward, leading to a downtrend that caused the cryptocurrency to relinquish a significant portion of its 2023 gains. Conversely, before July, BTC experienced a surge to its yearly high of $31,800, while the DXY declined.
Despite this development, Glassnode co-founder Yan Allemann suggests that in the coming months, it will be Bitcoin’s turn to reclaim the spotlight and assert its dominance once again.
BTC’s Last Consolidation Phase?
Glassnode co-founder Yan Allemann has shared insights on the current market conditions and predicts an imminent surge in Bitcoin’s value as the autumn approaches.
Allemann’s analysis suggests that the US Dollar is expected to reach a peak level of 106, which will catalyze a prime environment for Bitcoin.
Historically, the inverse correlation between the Dollar and Bitcoin has been observed, where a stronger Dollar tends to put downward pressure on the cryptocurrency’s price. Conversely, a peak in the Dollar often coincides with a favorable environment for Bitcoin to thrive.
This said, Allemann believes that Bitcoin is projected to reach the $37,000 level before embarking on a significant upward movement during the autumn season.
This anticipated surge in value aligns with the patterns observed in previous market cycles, where Bitcoin has experienced notable price rallies during the latter part of the year.
It remains to be seen how this narrative unfolds, but one thing is clear: the dynamics between Bitcoin and the US dollar continue to shape the cryptocurrency landscape.
Historical Data Reveals September Struggles For Bitcoin
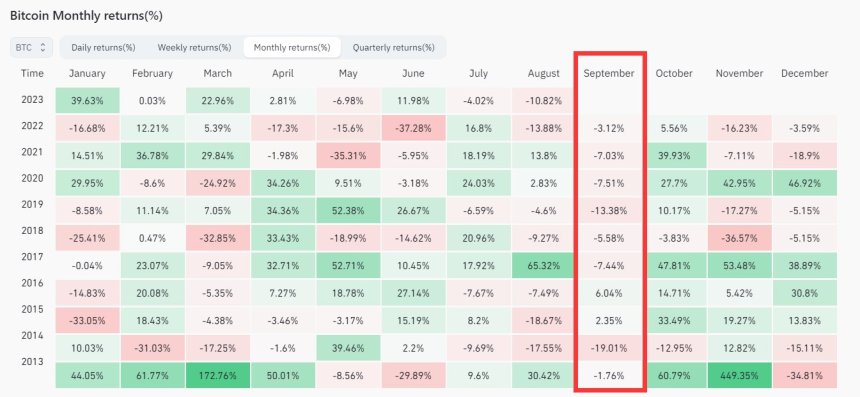
According to data by CoinGlass, August, and September have historically presented challenges for Bitcoin, making them notorious months for the cryptocurrency’s performance.
With 10 days remaining until the monthly close, August has already proven to be a difficult month for Bitcoin, experiencing a 12% decline over the past 30 days. However, this downtrend may not come to a halt just yet, as historical data indicates that September could pose additional obstacles to Bitcoin’s price trajectory.

Examining the chart above, it becomes evident that September has historically been a challenging period for Bitcoin.
In some instances, the cryptocurrency has witnessed substantial price drops, reaching as high as 19%. This suggests that the coming month could potentially be characterized by further downward pressure on Bitcoin’s price.
However, it is important to note that historical trends also indicate the possibility of more modest declines. In 2013, for example, Bitcoin’s price only decreased by 1% during September, defying the broader negative sentiment associated with the month.
This demonstrates that while September has a historical reputation for difficulty, it does not guarantee a significant downturn for Bitcoin in every instance.
While Bitcoin has faced headwinds in August and historically in September, it is worth remembering that the cryptocurrency has demonstrated resilience and the ability to recover from downturns in the past.
Market conditions, macroeconomic factors, and regulatory developments can all contribute to the price fluctuations of Bitcoin and other cryptocurrencies.
Featured image from iStock, chart from TradingView.com


