
Ether bounced off multi-year support, while a bullish MACD crossover could signal that ETH is on the path to new highs.
Ether (ETH) is currently displaying a technical pattern that follows a 2025 fractal, in which Ether gained 250%. The weekly timeframe chart shows Ether retesting an ascending trend line that has supported the price since 2022.
A bullish cross from the moving average convergence divergence (MACD) indicator also confirmed the price bottom.
Ether’s current price action is following a similar pattern, with the price again bouncing off the same structural support and a confirmed bullish MACD crossover.
“Similar structure. Similar dump. Similar consolidation,” analyst Max Crypto said in an X post on Tuesday, adding:
“What if $ETH repeats the Q2/Q3 2025 rally?”
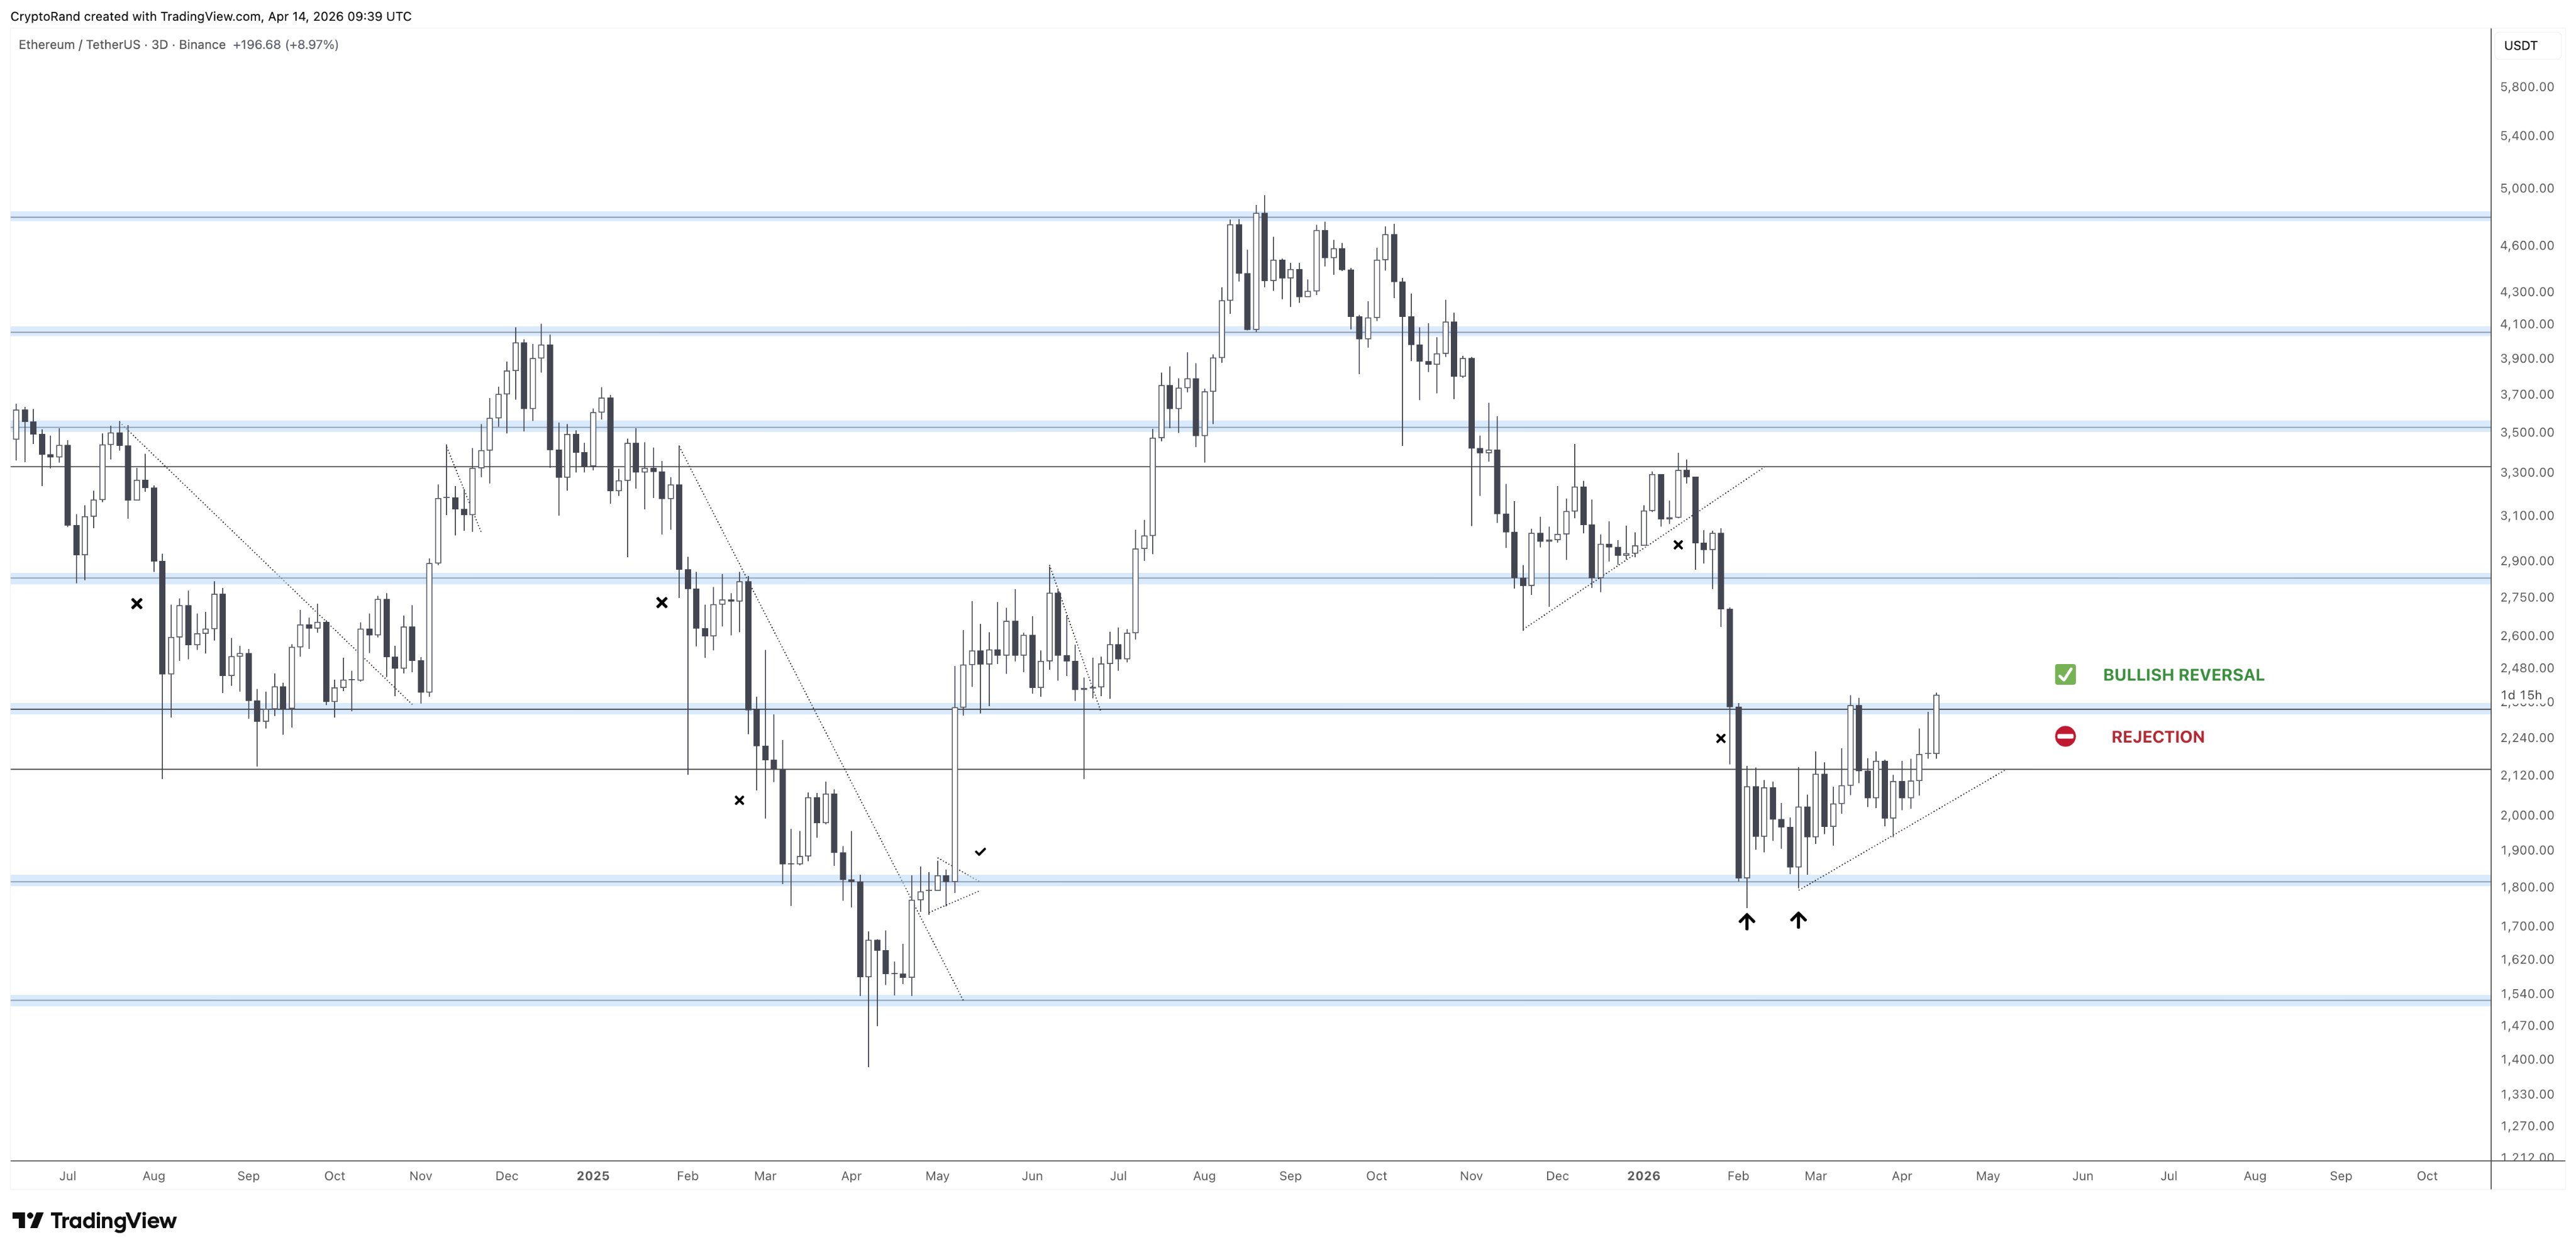
If history repeats itself, ETH may rally by more than 250% toward $6,300. Further confirmation of a trend reversal now hinges on Ether “crossing the key $2,400 range,” fellow analyst Cryptorand said, adding:
“If it manages to consolidate over, it will trigger the bullish reversal.”
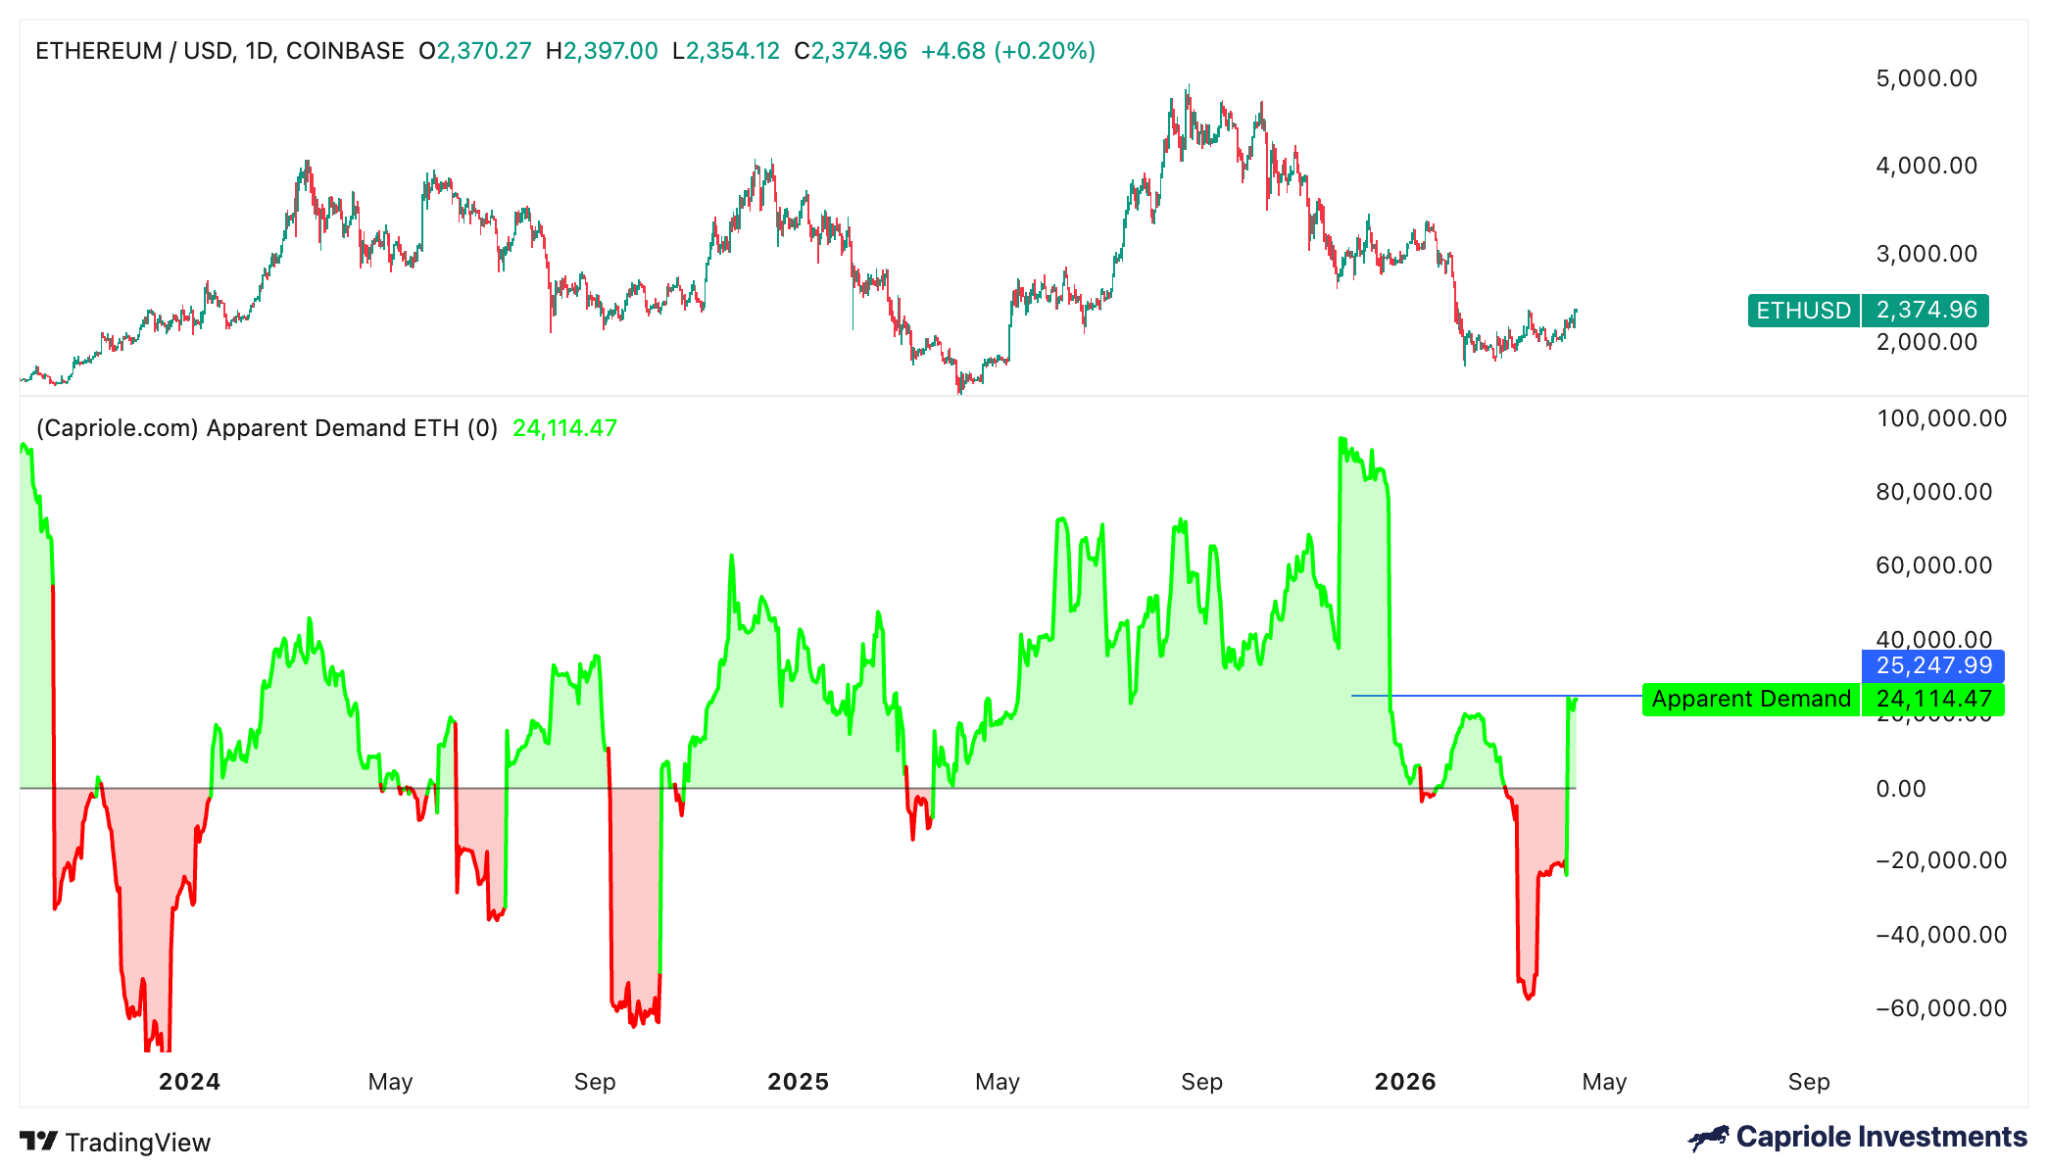
Ether’s apparent demand hits a 90-day high
Ether’s apparent demand turned positive after rising to its highest level since Dec. 31, 2025, as hopes for a deal between the US and Iran boosted investor sentiment.
Capriole Investment’s Ethereum Apparent Demand metric reveals that the demand for Ether has been positive since April 8, rising to a high of 24,111 ETH on April 14.
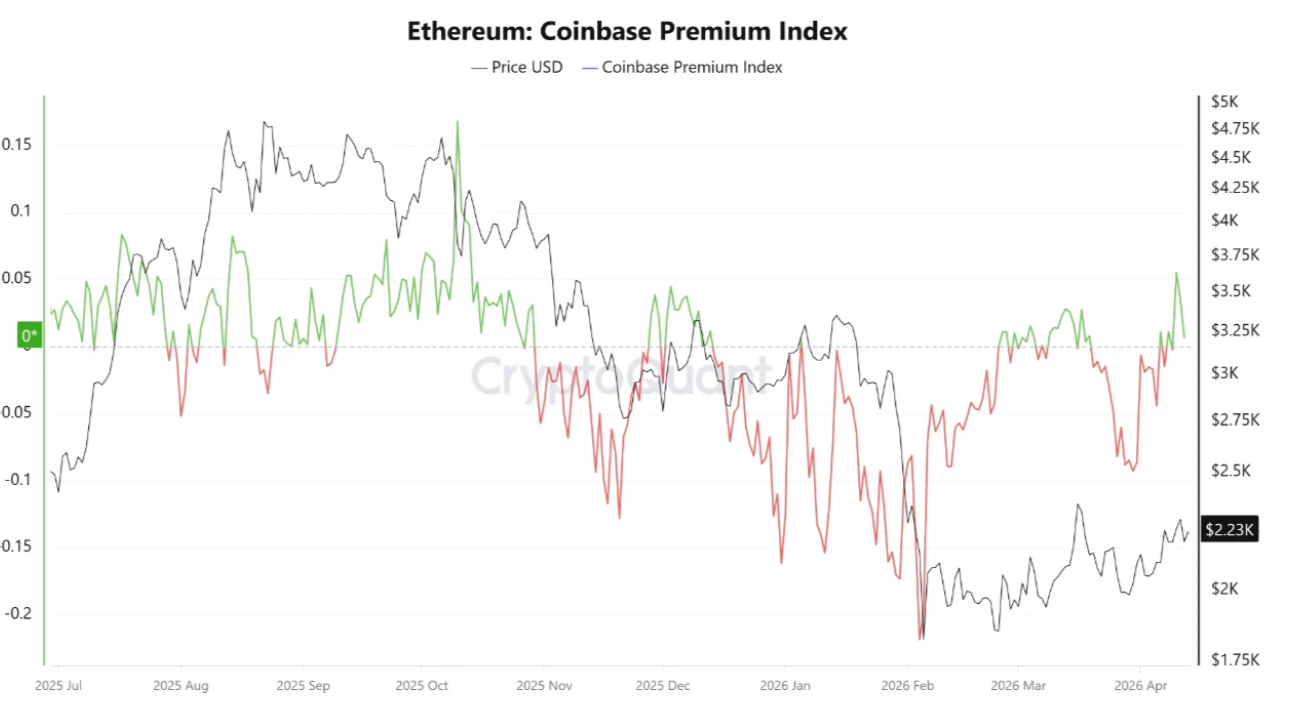
The surge in Ether’s apparent demand could be attributed to rising US demand, as measured by the Coinbase premium index.
The ETH Coinbase premium index measures the price difference between the ETH/USD pair on Coinbase and Binance’s ETH/USD equivalent.
The chart below shows that the index has flipped positive, rising to 0.055, its highest level since October 2025.
“The index’s rise to 0.055 reflected a significant influx of institutional liquidity, ” CryptoQuant analyst Arab Chain said in a Quicktake analysis on Tuesday, adding:
“It typically signals increased demand from institutional investors, particularly in the US market.”
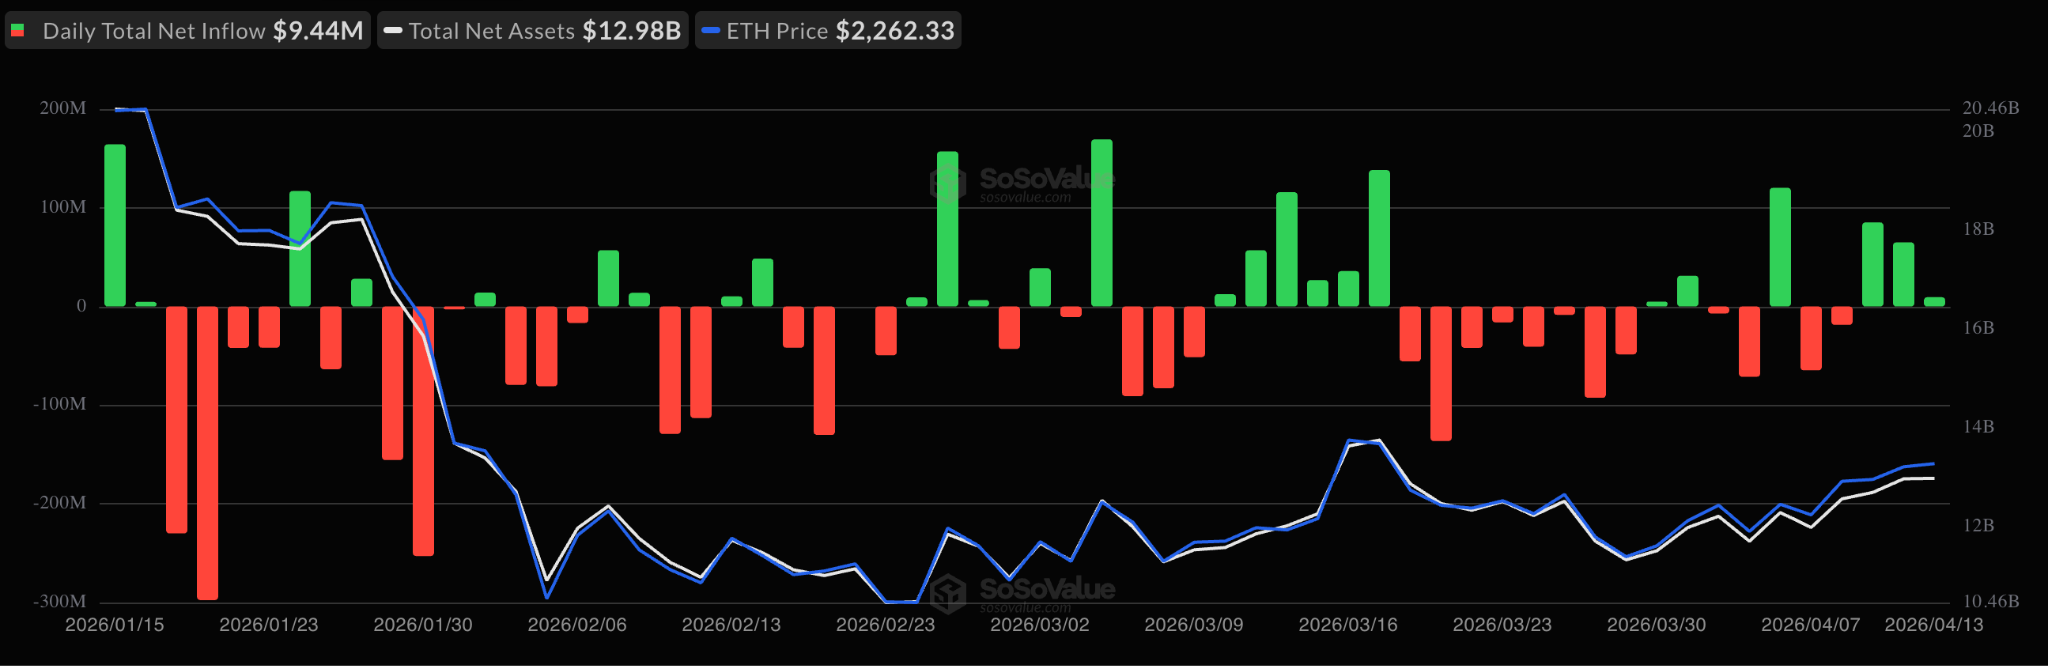
Meanwhile, spot Ethereum ETFs have recorded net inflows for three consecutive days, totaling $160 million.
Global Ether exchange-traded products (ETPs) also recorded $196.5 million of inflows last week, reinforcing increased demand for ETH among institutional investors.
This article is produced in accordance with Cointelegraph’s Editorial Policy and is intended for informational purposes only. It does not constitute investment advice or recommendations. All investments and trades carry risk; readers are encouraged to conduct independent research before making any decisions. Cointelegraph makes no guarantees regarding the accuracy or completeness of the information presented, including forward-looking statements, and will not be liable for any loss or damage arising from reliance on this content.


