
Key takeaways:
-
ETH gained 50% in two weeks, and Elliott Wave models are pointing to a possible $9,000 top by early 2026.
-
Onchain fundamentals are strong: 28% of ETH is staked, exchange balances are at their lowest since 2016, and new buyer inflows are accelerating.
-
Network usage remains near full capacity, even after multiple block gas limit increases, highlighting persistent demand.
Ether (ETH) has surged 50% in just two weeks, regaining investors’ attention after a largely underwhelming cycle. Still, at $3,730, ETH remains 23% below its all-time high from November 2021. Some analysts now point to price targets that could more than double its current value.
Could the best still lie ahead for the second-largest cryptocurrency? Onchain trends, trading flows, and blockchain activity all suggest the rally may be just getting started.
ETH charts point to undervaluation
Despite its recent gains, ETH appears to lag behind broader market sentiment. According to Glassnode, the MVRV Z-score — which compares Ethereum’s market cap to its realized cap (the total capital inflow into the asset) — remains well below peak cycle values. While ETH is no longer in the “bearish” range, it still trades far from levels typically associated with euphoric tops.
Relative to Bitcoin, ETH also has a lot of ground to cover. Over the past year, BTC has rallied 74% while ETH dropped 28%, widening the performance gap. However, that strength has come at a cost: BTC dominance is now historically elevated. Analysts at Bitcoin Vector suggested ETH is now “under-owned, undervalued, and in catch-up mode.” A rotation could be in the making.
In the near term, the $4,000 mark stands out as a critical psychological and technical barrier. Should ETH break above it, many analysts expect acceleration.
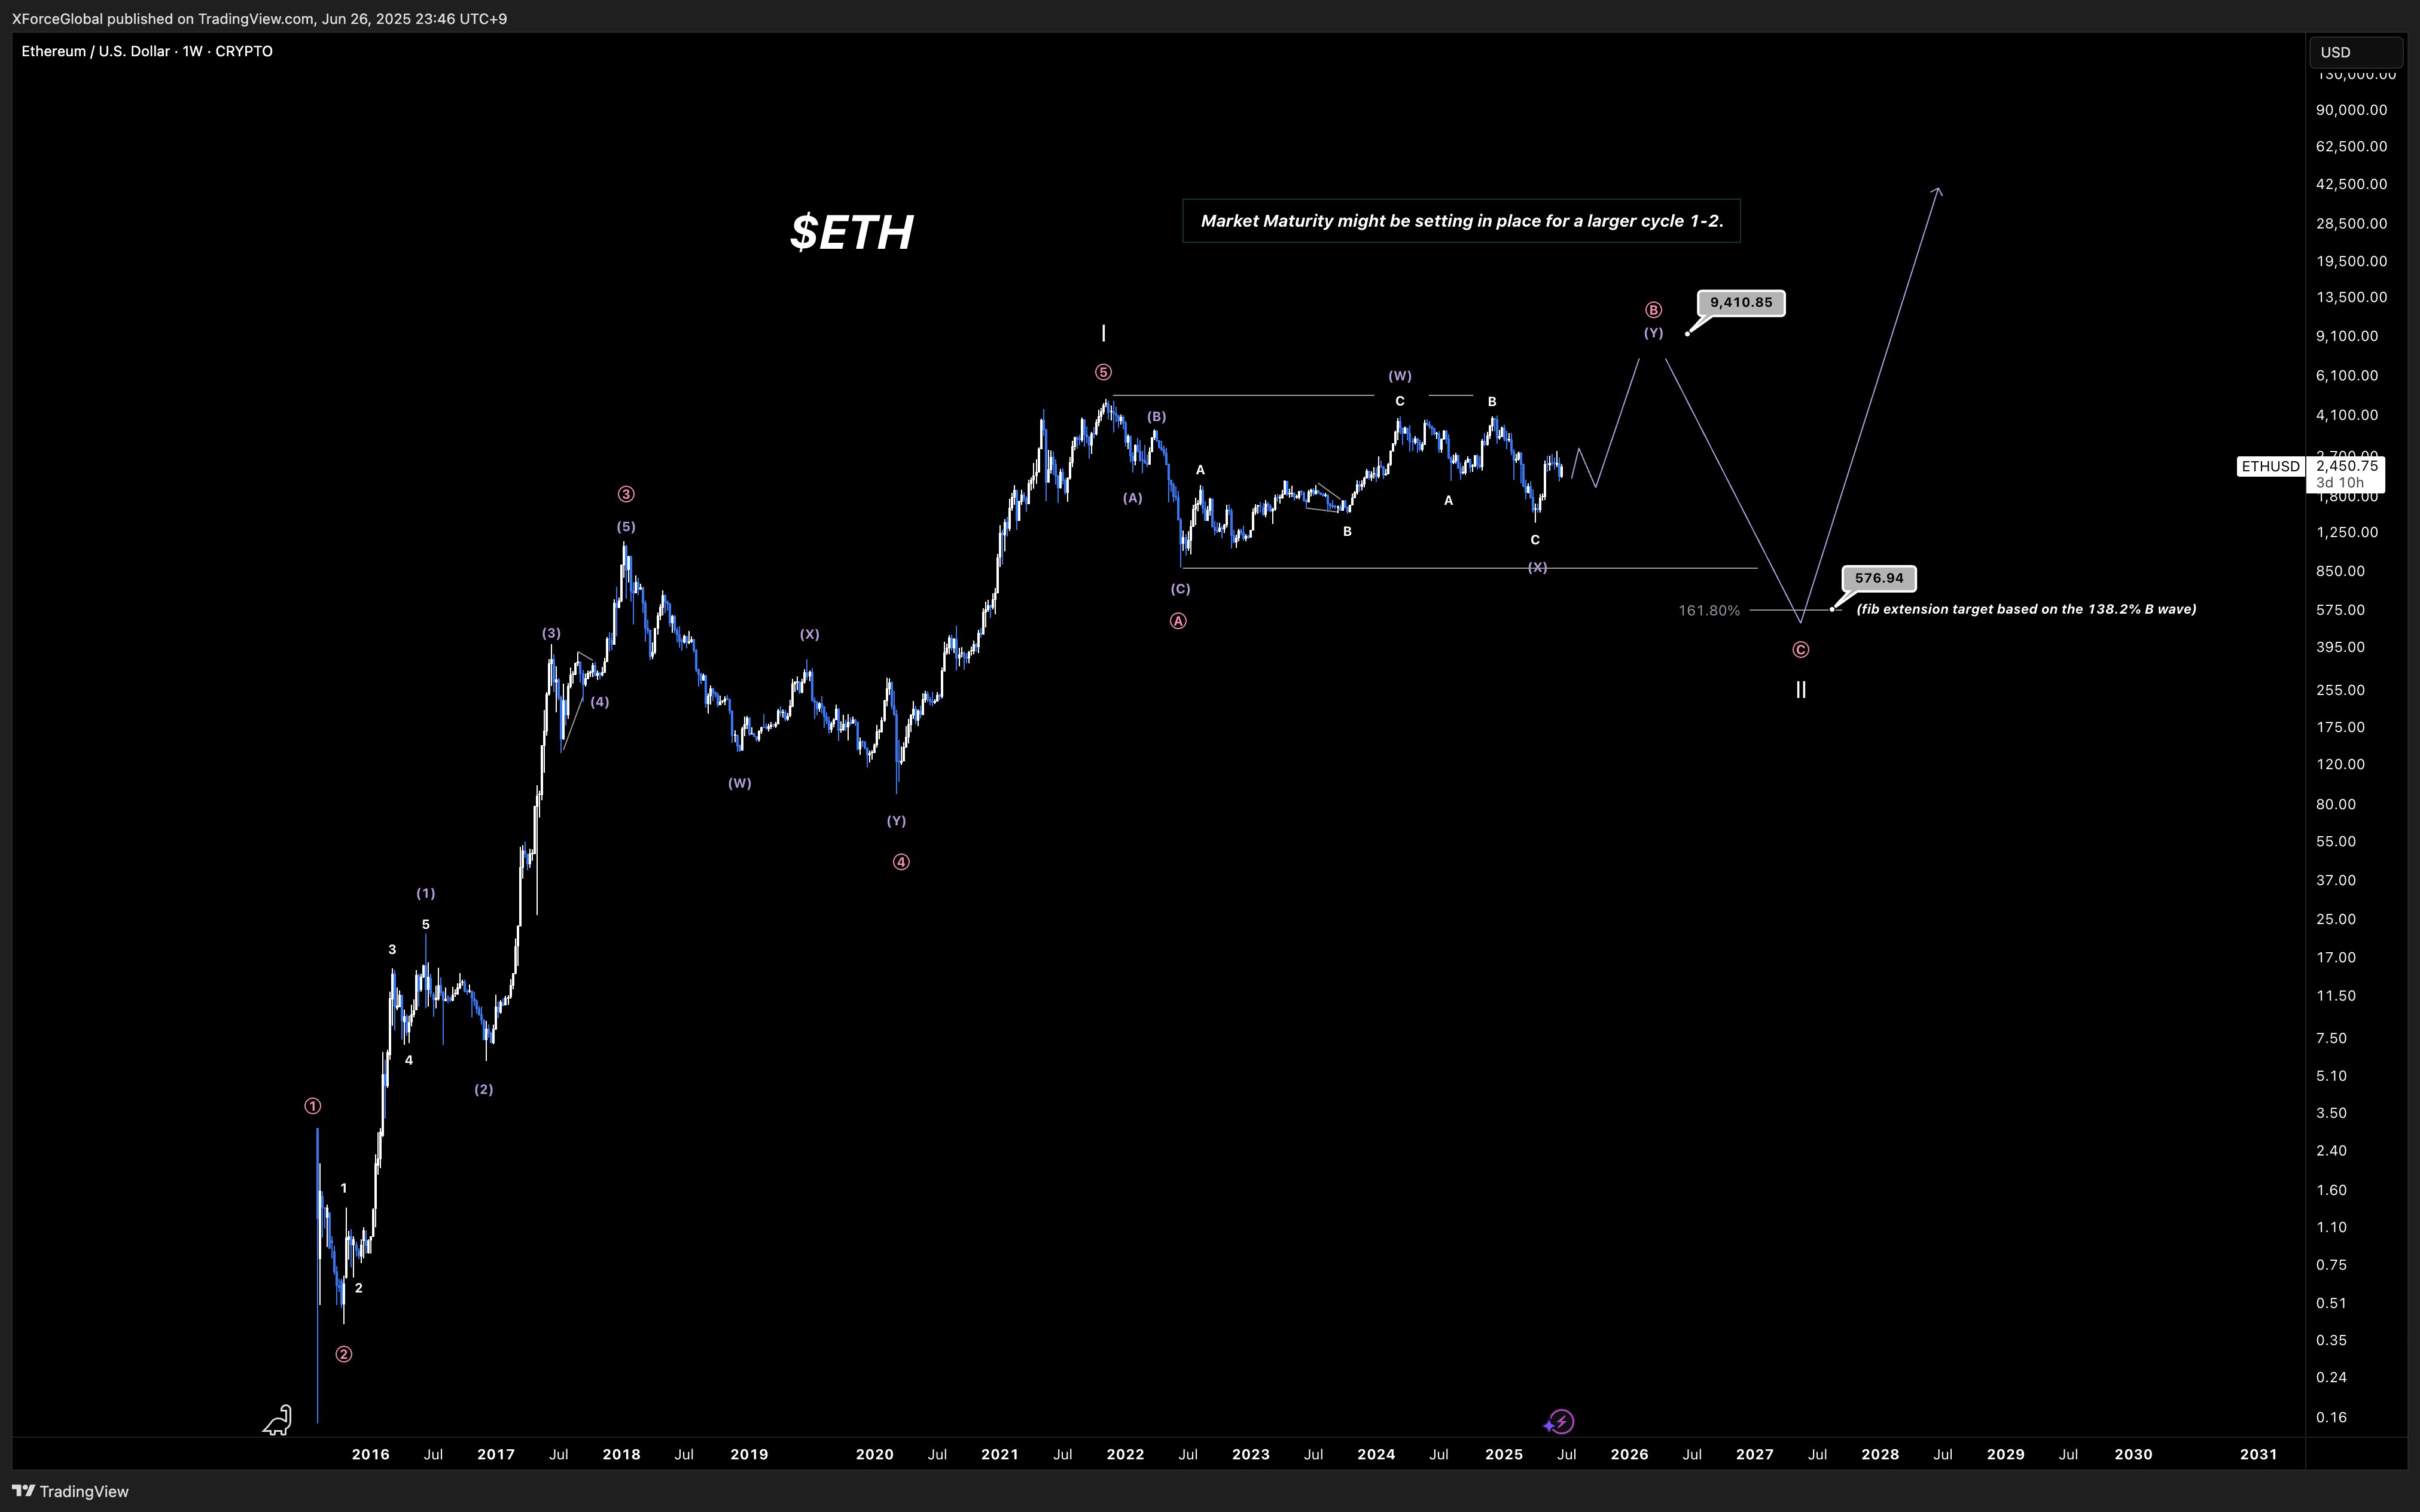
One perspective comes from Elliott Wave analysis, a model positing that market prices move in five recurring, psychology-driven wave patterns. According to the XForceGlobal analysis posted a month ago (already partly validated, though a bit ahead of the forecast), ETH appears to be advancing through a third impulsive wave. If the pattern holds, this phase could peak around $9,000 by early 2026, provided macro conditions remain supportive. That would mark Ethereum’s next major breakout before the onset of the next market downturn.
Onchain trends point to tightening supply and increasing demand
Onchain metrics suggest Ether’s bullish setup is not just speculative—it’s structural.
Currently, more than 34 million ETH is staked, representing 28% of the 120.7 million total supply. That’s capital locked long-term, reducing circulating supply and signaling strong investor conviction.
The remaining supply isn’t particularly liquid either. Exchange balances have dropped to 16.2 million ETH, the lowest level since 2016. Reduced sell-side liquidity tends to support upward price moves, especially when paired with fresh demand.
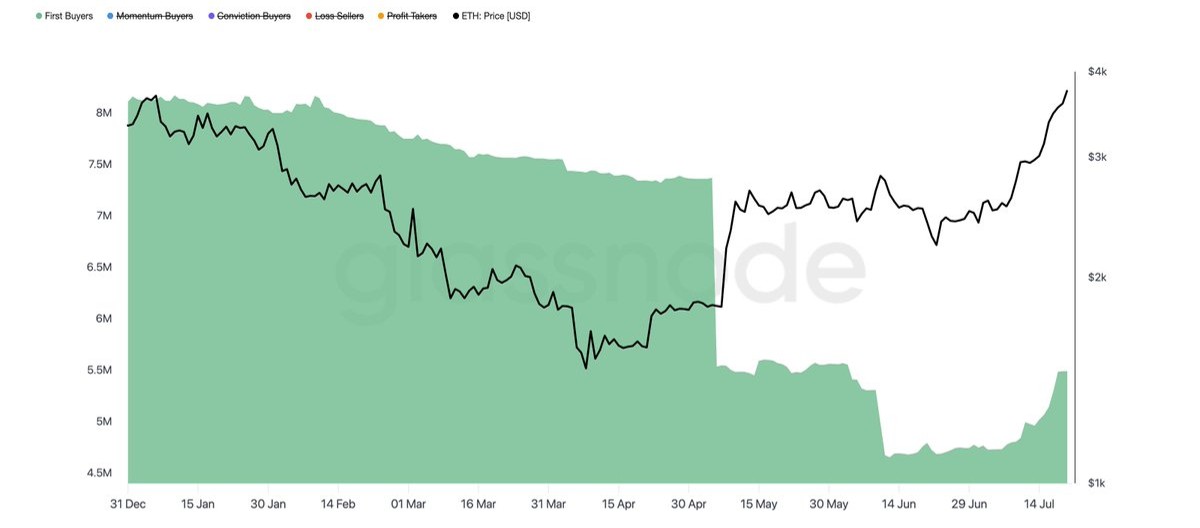
That demand seems to be picking up. Since early July, the supply held by first-time buyers has jumped by about 16%, according to Glassnode. This influx of short-term holders suggests growing interest from new market participants. Glassnode analysts admitted this was the first sign of a trend reversal that they have noted.
Beyond onchain metrics, this trend is also visible in an apparent increase in spot Ether ETFs inflows, which have gained over $4 billion in the past two weeks.
Around 94.4% of ETH’s supply is currently in profit. However, unrealized sentiment remains surprisingly muted. Glassnode’s NUPL indicator (Net Unrealized Profit/Loss) registers 0.47 for ETH, a zone labeled “Optimism/Anxiety.” For comparison, Bitcoin reads 0.57 and Ripple 0.62—both entering “Belief/Denial.” This suggests ETH still has room to grow before investor euphoria kicks in.
Ethereum activity: capacity expands, and demand keeps up
Beyond speculation, Ether’s value depends on actual usage, and that activity is growing in subtle but significant ways.
While average transaction fees have dropped to historic lows—just 0.0004 ETH per transfer—that doesn’t mean Ethereum is quiet. Rather, it reflects improved efficiency, especially with much of the load now handled by layer 2s. To properly gauge demand on the network, fees in ETH can mislead; gas offers a clearer view of the actual computational work being consumed.
Related: How to use Grok for real-time crypto trading signals
As Ethereum continues its push for scalability, block gas limits have been steadily raised—most recently in July 2025, following earlier increases in February 2025, September 2022, May 2021, and June 2020. Notably, after nearly every adjustment, blocks filled almost immediately and stayed that way. This suggests that demand wasn’t just responsive—it was already there, waiting. Early signs from this Tuesday’s upgrade point to the same pattern repeating. In effect, Ethereum has been operating at or near full capacity, with latent demand consistently surfacing the moment new room is made.

Transaction types have changed, though. NFTs, which consumed much of Ethereum’s blockspace in 2021, now represent a tiny share. DeFi has also cooled. What’s rising instead is a broad category of “Other” DApps: infrastructure protocols, rollup proof publishing, automation, and likely new types of modular apps.
Stablecoin transactions and “vanilla” ETH transfers—simple value movements from one address to another—are also on the rise. That signals increased settlement and trading activity, consistent with a developing bull run.
This article does not contain investment advice or recommendations. Every investment and trading move involves risk, and readers should conduct their own research when making a decision.


