
Key takeaways:
-
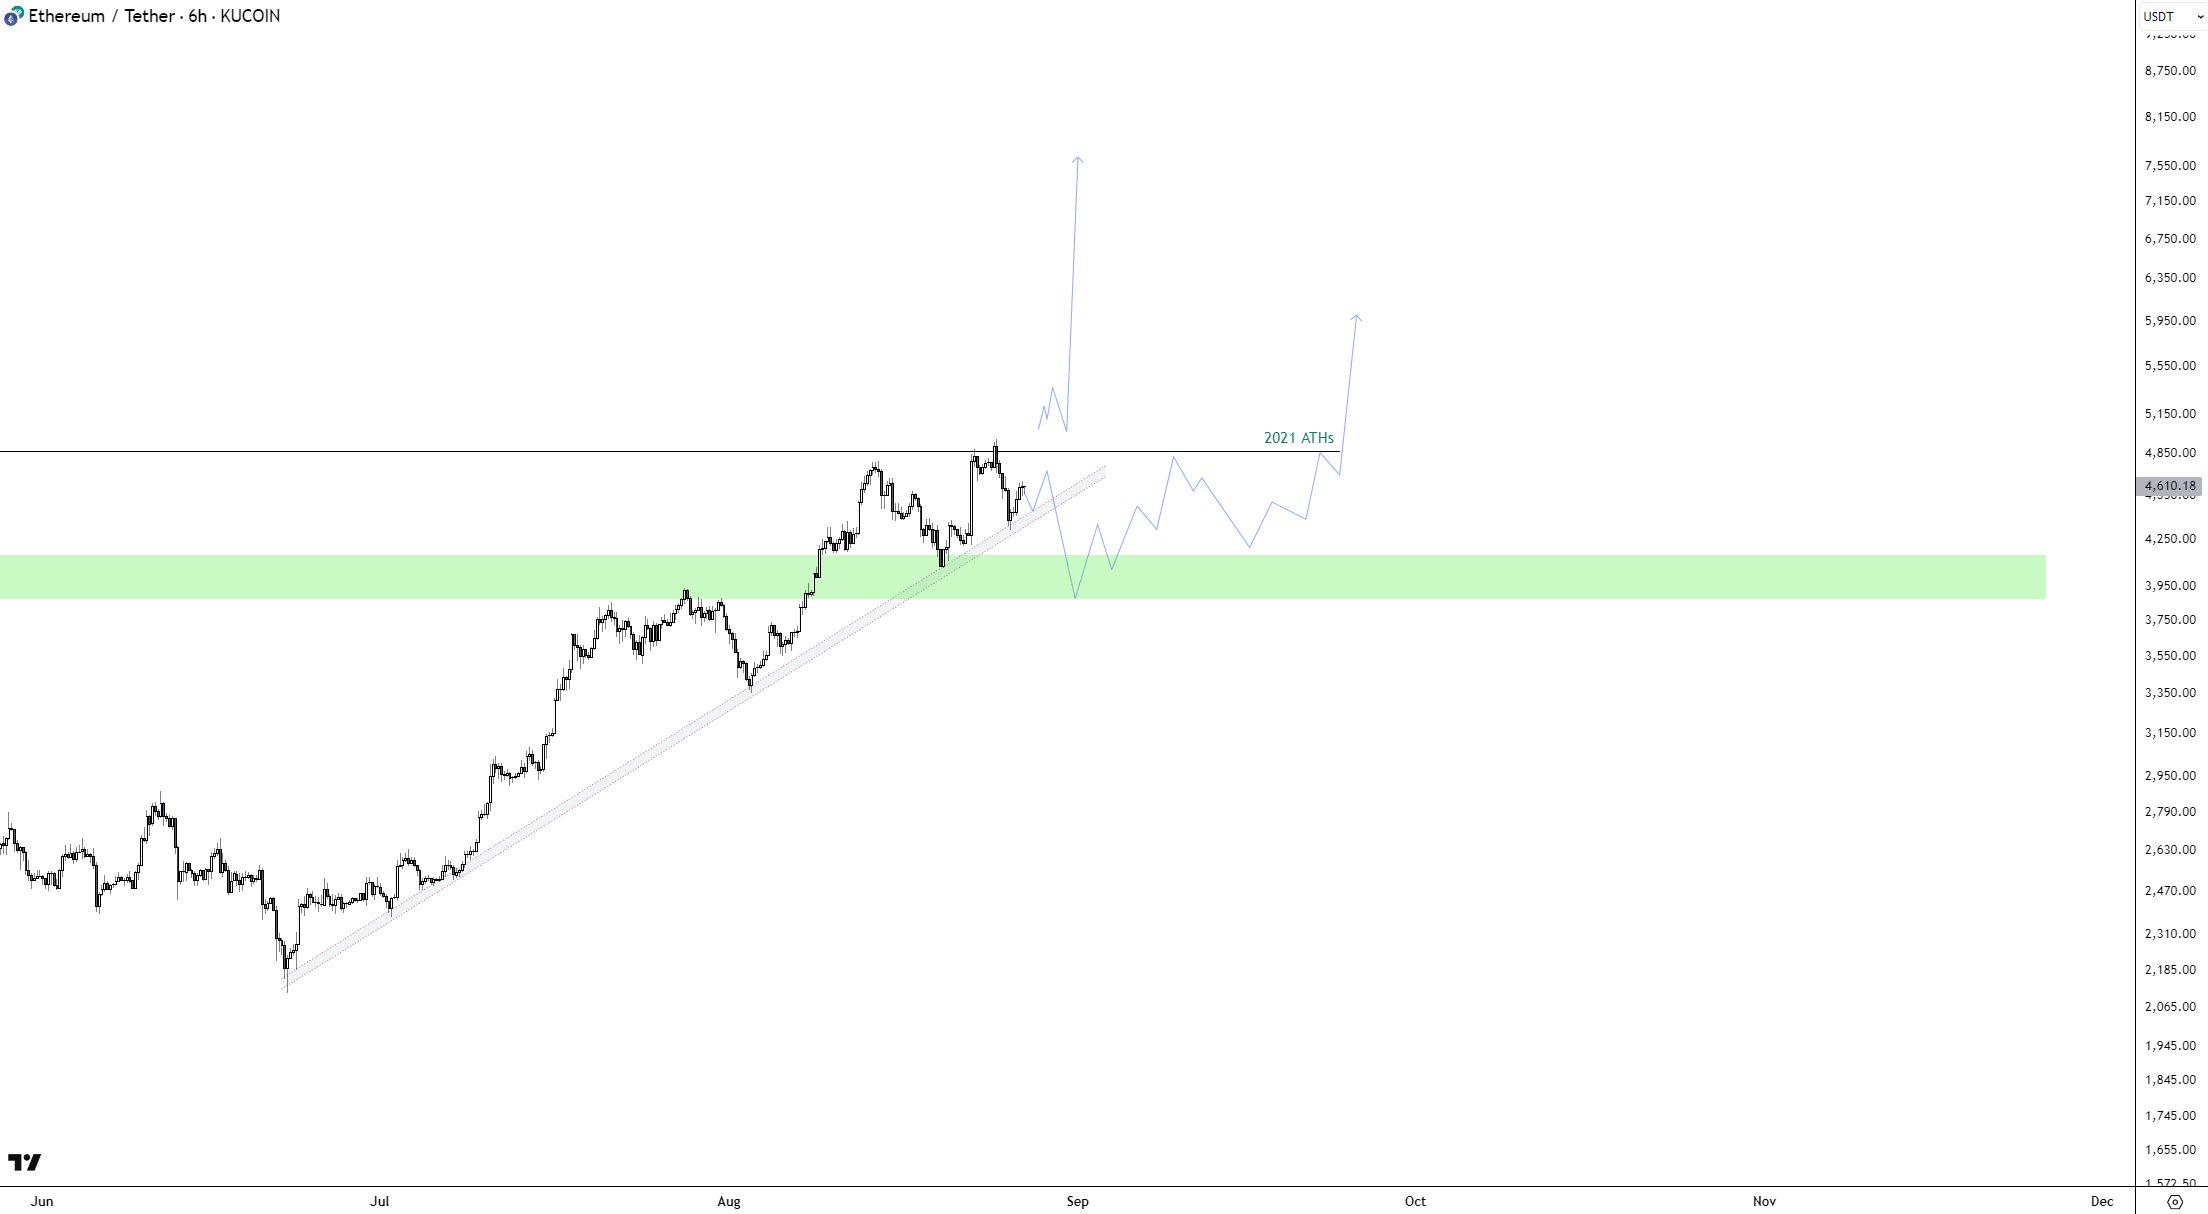
A bullish pattern on the ETH chart predicts a rally to $10,000, with $5,000 as the critical resistance level.
-
Analysts stress that short-term volatility may precede ETH’s multi-year bullish expansion phase.
-
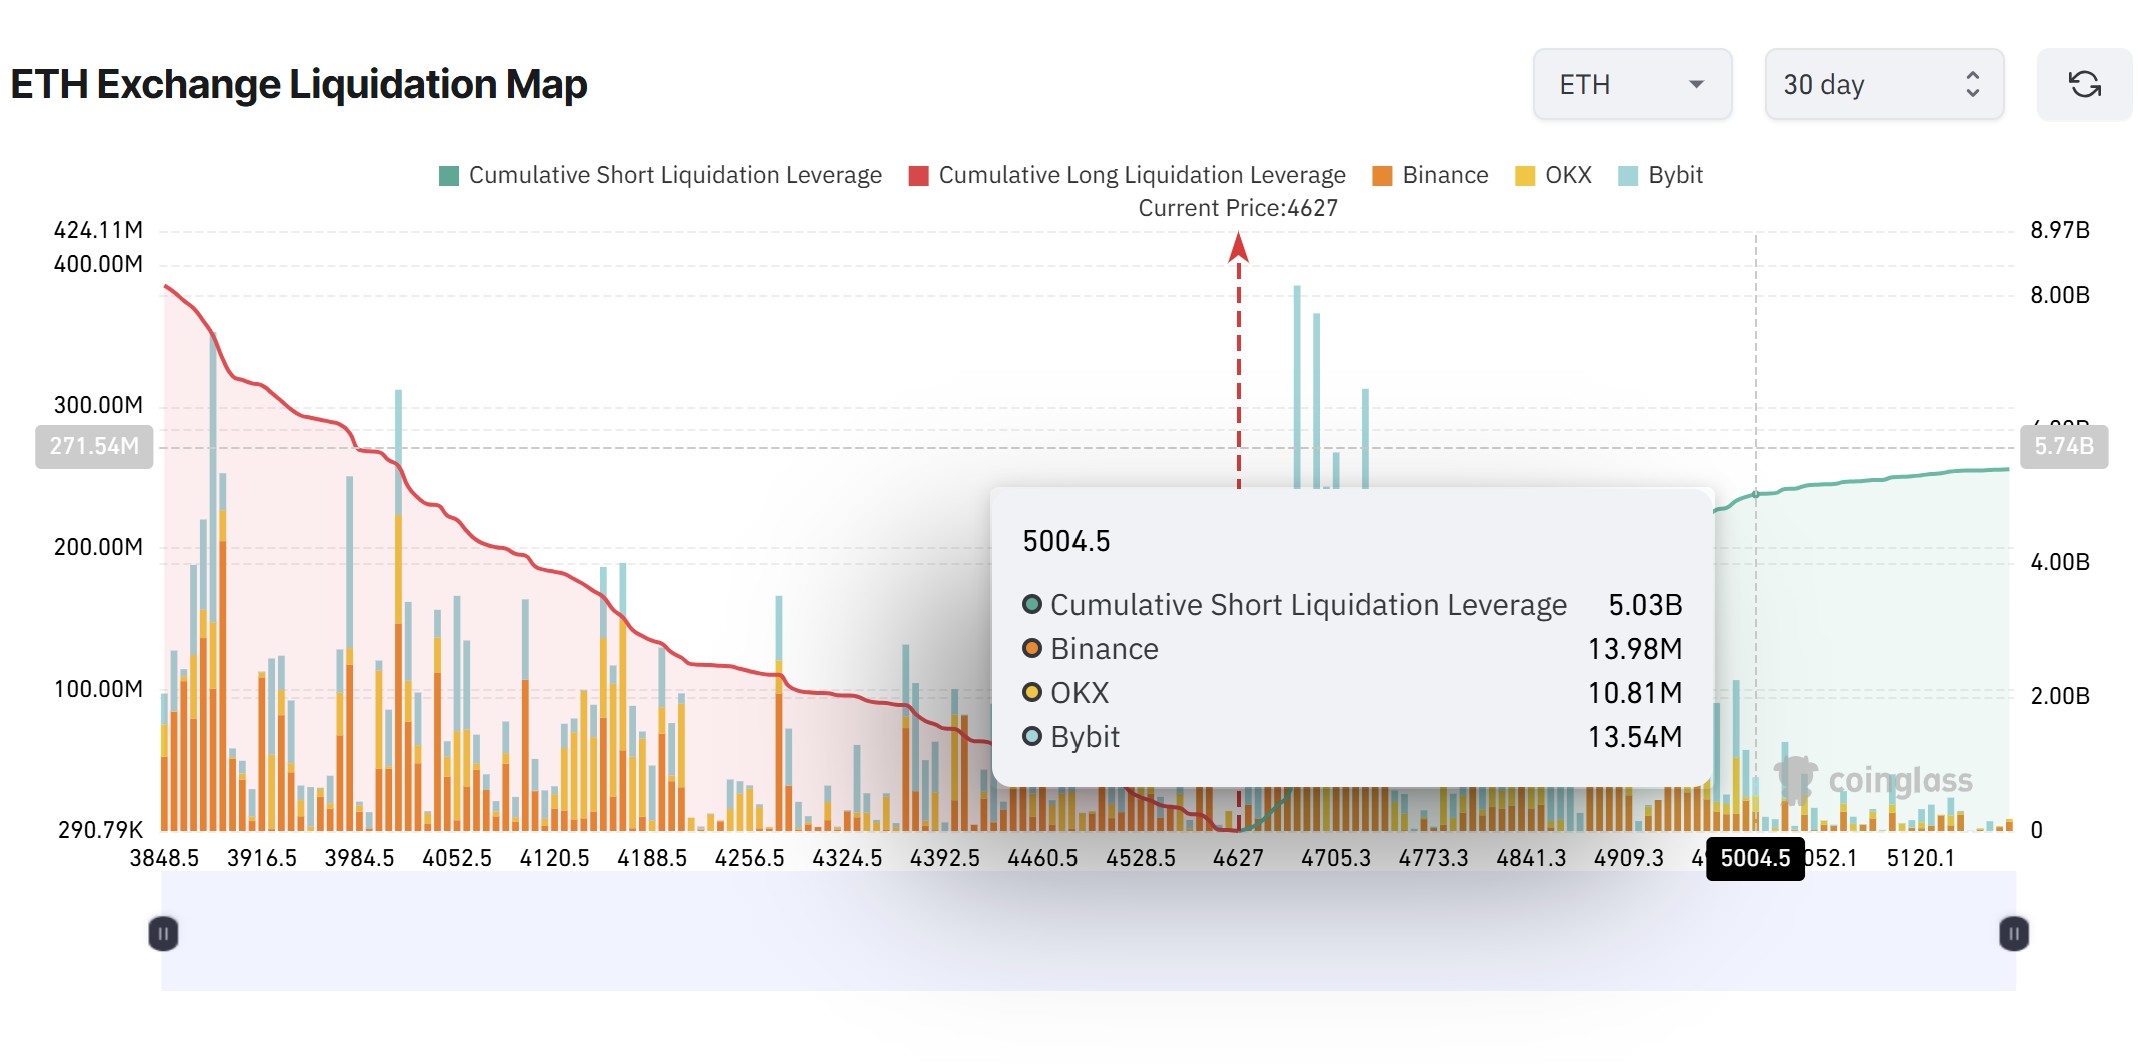
A rally to $5,100 could trigger $5 billion in short position liquidations.
Ether (ETH) continues to flash bullish technical signals, with crypto analyst Jelle highlighting a “megaphone pattern” on the weekly chart that targets the $10,000 mark.
The megaphone, also known as a broadening formation, represents widening price swings with progressively higher highs and lower lows. A confirmed breakout above resistance often leads to explosive rallies, but the structure can also turn bearish if momentum stalls.
Currently, the immediate resistance remains at $5,000. Extending position above this level would liquidate an estimated $5 billion in cumulative short positions, potentially extending the megaphone rally.
Failure to clear the $5,000 threshold could trigger a pullback toward the 12-week simple moving average (SMA, blue line) near $3,500 or the pattern’s lower support at $3,000, which coincides with the 25-weekly SMA (orange line). Volume confirmation is crucial, as weak participation raises the risk of a false breakout.
Crypto trader Merlijn emphasized the possibility of a bullish breakout and pointed out that ETH faces a dense sell wall near $5,100, “the kind of level whales dream about.”
The trader expects liquidity at this zone to act as a magnet, torching over-leveraged shorts. “Play the hunter, not the hunted,” Merlijn noted, suggesting whales could drive price into that liquidity pocket.
Related: Ethereum‘s best month ever puts $7K ETH price within reach
Analysts say ETH could stay “bullish for years”
While short-term swings dominate market chatter, technical analyst Jackis argued that ETH is “insanely bullish for years to come,” noting the asset recently broke out of a 4.5-year institutional accumulation range.
According to the analyst, the prior four-year cycle effectively ended in December 2024, paving the way for a new structural expansion period.
However, Jackis warns of possible mid-term shakeouts before the next leg higher. ETH has faced multiple rejections from its all-time highs and is currently testing its sixth diagonal trendline resistance, levels that historically tend to break after repeated attempts.
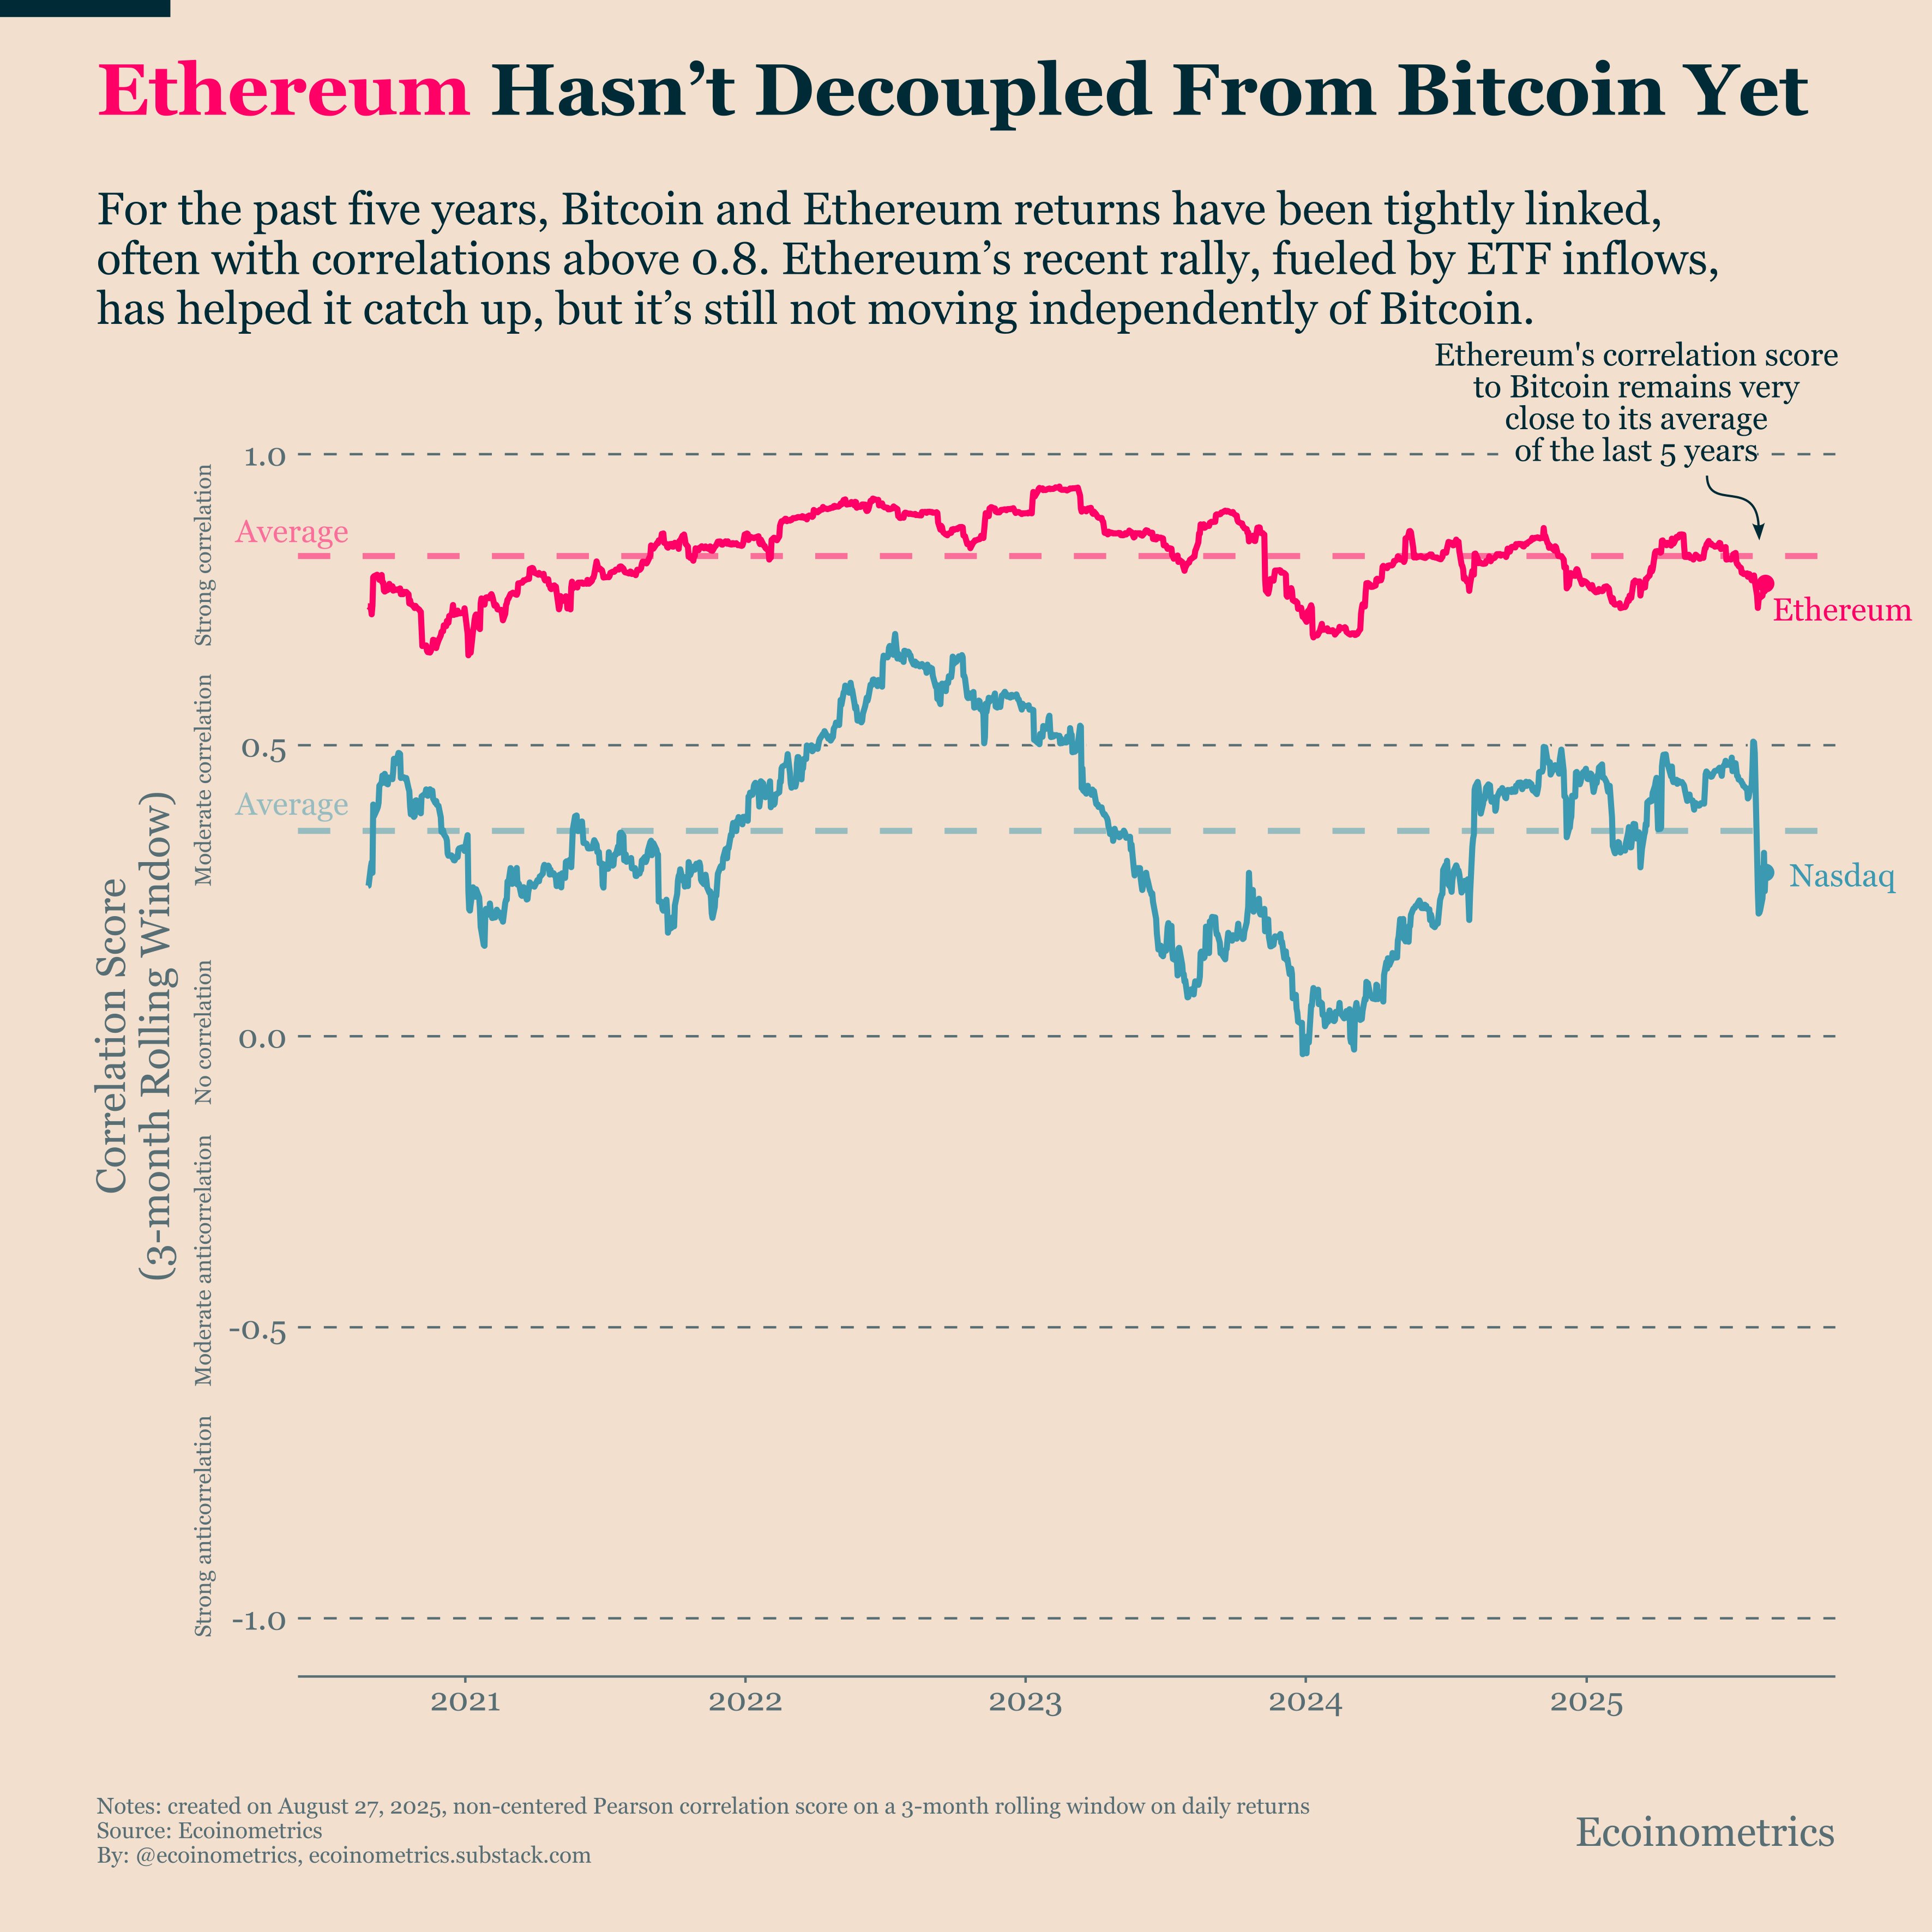
A deeper retest into support, similar to Bitcoin’s $25,000 correction in mid-2023, could trigger fear-driven selloffs before resuming the larger uptrend. The correlation between Bitcoin and Ether should also be tracked.
According to ecoinometrics, despite ETH’s recent outperformance, it remains strongly correlated to BTC. In an X post, the market analysis platform said,
“ETH is holding up better than BTC in price terms, but the correlation tells a different story. Over the past five years, ETH’s correlation with BTC has averaged above 0.8 and today it’s still right around that level.”
Jackis emphasizes that even in the case of near-term corrections, the high time frame outlook remains intact. Sustained acceptance above the 2021 all-time highs of $4,880 would signal immediate continuation.
Related: BlackRock Bitcoin ETF holdings overtake Coinbase, Binance; ETH may be next
This article does not contain investment advice or recommendations. Every investment and trading move involves risk, and readers should conduct their own research when making a decision.