Ethereum has seen an interesting trend in its price action over the past two weeks. Despite a strong surge in the price of Bitcoin, ETH has been an underperformer.
In the past 10 days, BTC has gained approximately 16% while ETH has only gained around 6%. This is a stark difference from earlier this year, when ETH surged dozens of percent while Bitcoin gained a mere 5-10%.
Analysts fear that this weakness is a precursor to a strong drop to the downside.
Ethereum may be saved by Bitcoin, though. Analysts say that despite the recent drop from the local highs, BTC’s price action suggests the asset remains in a clear bull market.
Related Reading: Here’s Why Ethereum’s DeFi Market May Be Near A Bottom
Ethereum Primed to Plunge Toward Low-$300s if Key level Is Lost
Analysts fear that Ethereum could be primed to see a brief reversal to the downside unless the current supports hold. One crypto-asset analyst shared the chart below on October 28th, noting how ETH is sitting on a cluster of pivotal short-term moving averages. These averages marked support in previous rallies and marked resistances during the September and early October consolidation.
The analyst who shared this chart noted that if ETH loses this support cluster, it could drop towards $300-315. If Ethereum fell to $315 from current levels, that would be a 20% drop from current prices. $315 was the lows that the leading cryptocurrency reached during September’s correction.
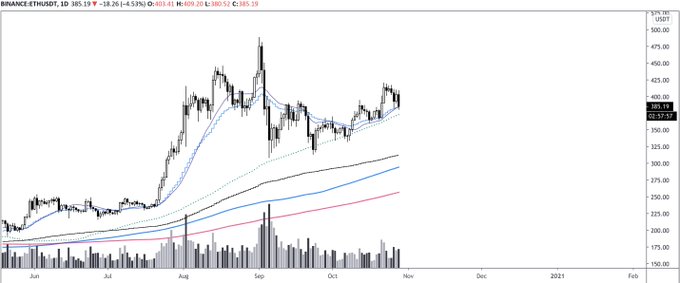
Chart of ETH's price action over the past few months with analysis by crypto trader
Related Reading: Tyler Winklevoss: A “Tsunami” of Capital Is Coming For Bitcoin
Bitcoin Looking Much Better
Fortunately for Ethereum, Bitcoin is looking much better. Should BTC continue its ascent, it is likely that ETH will eventually follow.
The chart below was shared by a leading analyst recently. It shows that should Bitcoin move above $14,000 on a macro basis, there will be little stopping the coin from rocketing higher and higher:
“The 2018 (start of the bear market) yearly open. This is it. This is the last “resistance”. Above this level, it’s thin air.”
The chart shows that $14,000 has long been an important level for Bitcoin. It marked the 2019 highs almost to a T and marked where the 2017 candle closed.
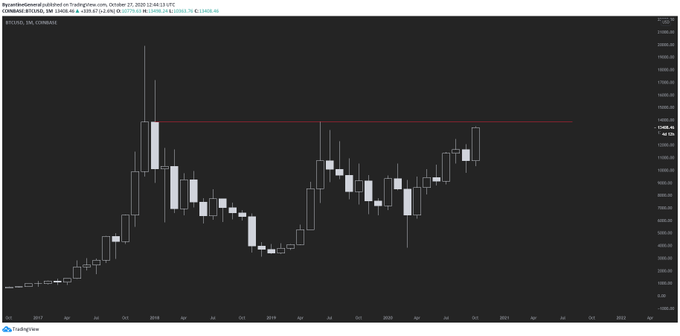
Source: BTCUSD from TradingView.com. Chart of BTC's price action since the start of 2017 with analysis by crypto trader Byzantine General (@Byzgeneral on Twitter).
Related Reading: 3 Bitcoin On-Chain Trends Show a Macro Bull Market Is Brewing
Featured Image from Shutterstock
Price tags: ethusd, ethbtc
Charts from TradingView.com
Ethereum Could Plunge Towards $315 Region if This Level Doesn't Hold


