Data shows that cryptocurrency investors’ sentiment has surged to extreme greed recently, a sign that may not be ideal for Bitcoin.
Bitcoin Fear & Greed Index Is In The Extreme Greed Territory Right Now
The “Fear & Greed Index” is an indicator created by Alternative that keeps track of the average sentiment present among the traders in the Bitcoin and wider cryptocurrency market.
The index represents this sentiment as a number between zero and 100. To calculate the score, the metric takes into account five factors: volatility, trading volume, social media sentiment, market cap dominance, and Google Trends.
Related Reading
When the Fear & Greed Index has a value greater than 54, the investors are greedy. On the other hand, values under 46 imply that the market is fearful currently. The region between these two cutoffs signifies the territory of a neutral mentality.
In addition to these three core sentiments, the index has two special zones: “extreme greed” and “extreme fear.” The former occurs when the metric surpasses 75, while the latter occurs at levels under 25.
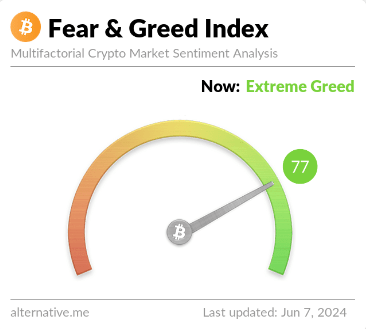
Now, here is what the sentiment in the Bitcoin market looks like right now based on the Fear & Greed Index:
As is visible above, the Bitcoin Fear & Greed Index has a value of 77 at the moment, which suggests that investors as a whole feel extreme greed.
The current value means, however, that the market is only just inside this territory. Earlier, the indicator had a lower value, but the latest price surge beyond the $71,000 level has meant that investors have openly jumped on the bull bandwagon.
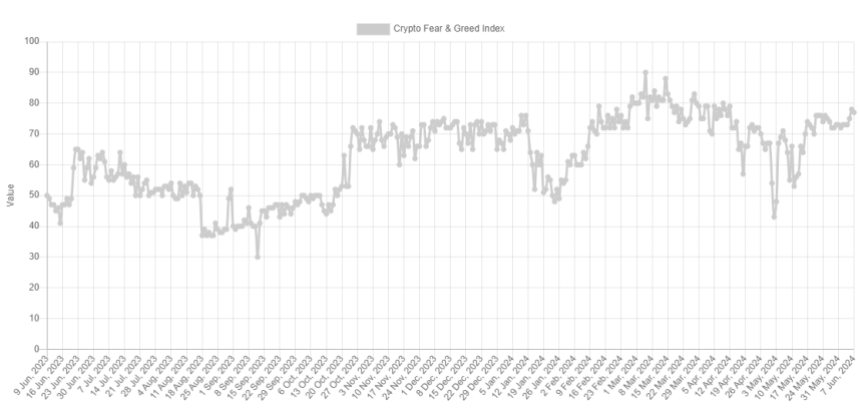
Below is a chart showing how the sector’s sentiment has changed over the past year.

The graph shows that the latest values of the Fear & Greed Index are the highest that the cryptocurrency has witnessed since the first half of April.
Between then and now, the only other time the indicator stepped inside the extreme greed zone was during a stretch in May. During this phase, 76 was the highest the metric could go, which is right at the region’s boundary.
Historically, the price of Bitcoin has tended to go against the majority’s expectations, and the stronger this expectation has become, the more likely it is that such a contrary move will occur.
Related Reading
Since the extreme sentiment zones are where the market turns the most lopsided, reversals are probable. Naturally, extreme fear is where bottoms happen, while extreme greed can lead to tops.
As such, the latest breach into the extreme greed territory could perhaps be bad news for the recovery rally. It should be noted, though, that the current level of the indicator may still not be too high compared to past bull run levels. For example, the rally to the new all-time high price in March saw the indicator peak at 90.
BTC Price
So far in its recovery run, Bitcoin has risen towards the $71,500 level.
Featured image from Dall-E, Alternative.me, chart from TradingView.com


