Trader sentiment has turned bearish following Bitcoin’s (BTC) 11% slump this week. Although Bitcoin is taking support near $25,000, several analysts are factoring in another leg down toward the crucial $20,000 level.
The weakness is not limited to the cryptocurrency markets alone. United States equities markets also witnessed a losing week. The S&P 500 Index fell 2.1% and the Nasdaq Composite dropped about 2.6%, both indices recording a three-week losing streak. This suggests that traders are in a risk-off mode in the near term.
The fall in Bitcoin dragged several altcoins lower, indicating a broad-based sell-off. However, amongst the sea of red, there are a few altcoins that have stood out either by bouncing off strong support levels or by continuing their up-move.
Let’s study the charts of the top-5 cryptocurrencies that may buck the negative trend and stay positive over the next few days.
Bitcoin price analysis
Bitcoin has been range-bound between $24,800 and $31,000 for the past several days. After failing to sustain above the resistance, the price has dipped near the support of the range.
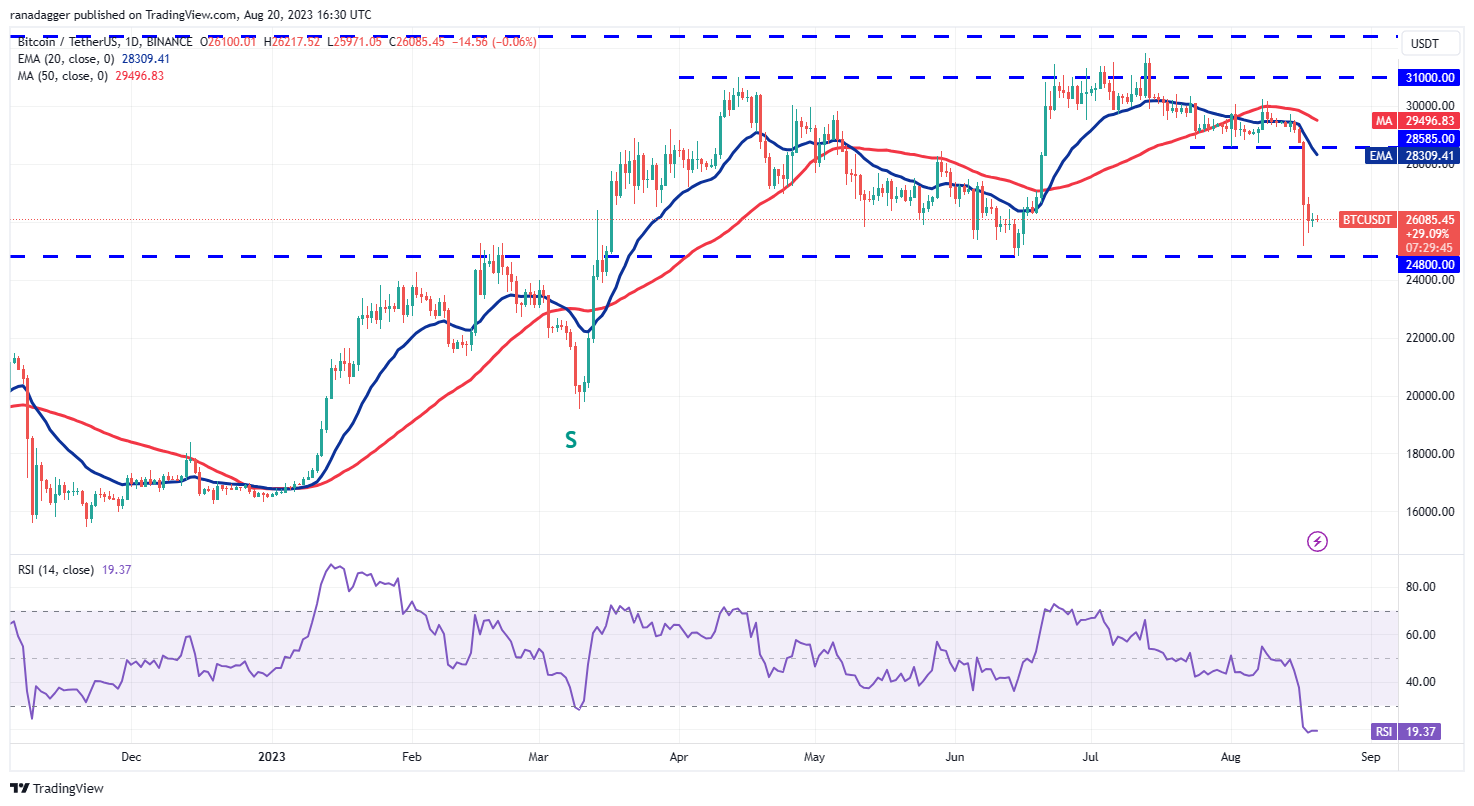
The fall of the past few days has pulled the relative strength index (RSI) into the oversold territory, indicating that a recovery may be around the corner. If the price rises from the current level, it could reach the 20-day exponential moving average ($28,309). The bears are likely to sell the rallies to this level.
If the price turns down from the 20-day EMA, the BTC/USDT pair may again drop to the crucial support at $24,800. If this support gives way, the pair may start a descent to $20,000.
On the upside, a break and close above the 20-day EMA will indicate that the pair may extend its stay inside the range for a few more days. The bulls will have to push and sustain the price above $31,000 to start a new up-move but that looks a little far-fetched at the moment.
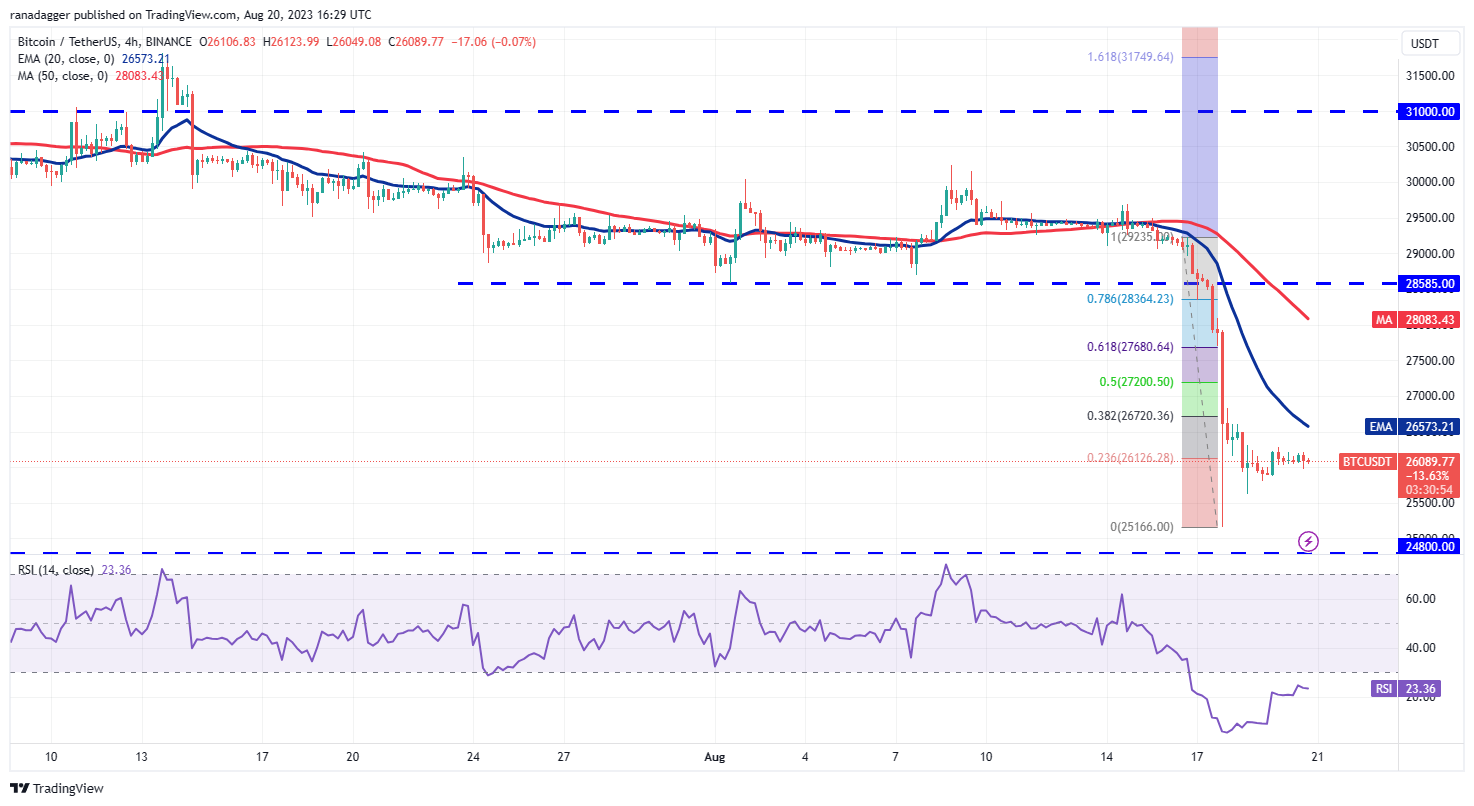
Both moving averages are sloping down and the RSI is in the oversold territory on the 4-hour chart, indicating that bears are in command. If the price turns down from the 20-EMA, the pair may retest the support zone between $25,166 and $24,800.
Conversely, a break and close above the 20-EMA could signal that the bears may be losing their grip. That could start a rally to the 50% Fibonacci retracement level of $27,200 and then to the 61.8% retracement level of $27,680.
Hedera price analysis
Hedera (HBAR) turned down from the overhead resistance at $0.078 on Aug. 15, indicating that bears are active at higher levels. However, a minor advantage in favor of the bulls is that the buyers purchased the dip to the 50-day SMA ($0.054).
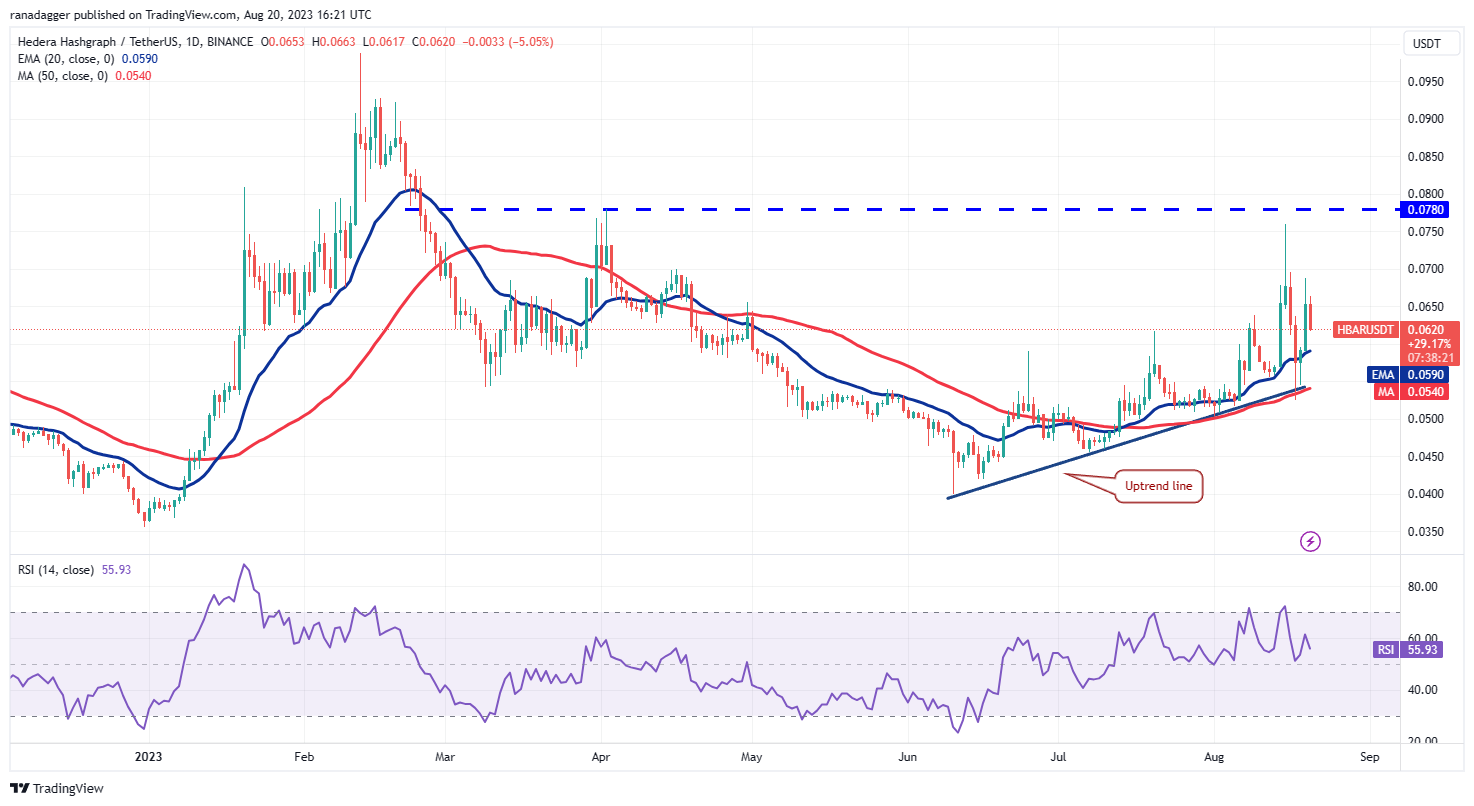
Both moving averages are sloping up and the RSI is in the positive zone, indicating that the buyers have the upper hand. The bulls will again try to push the HBAR/USDT pair to the overhead resistance at $0.078. If this obstacle is surmounted, the pair may surge to $0.093 and eventually to $0.099.
Instead, if the price turns down and breaks below the 20-EMA, it will suggest that bears continue to sell on rallies. The pair could then retest the support at the uptrend line. A break below this level may open the gates for a decline to $0.045 and then $0.040.
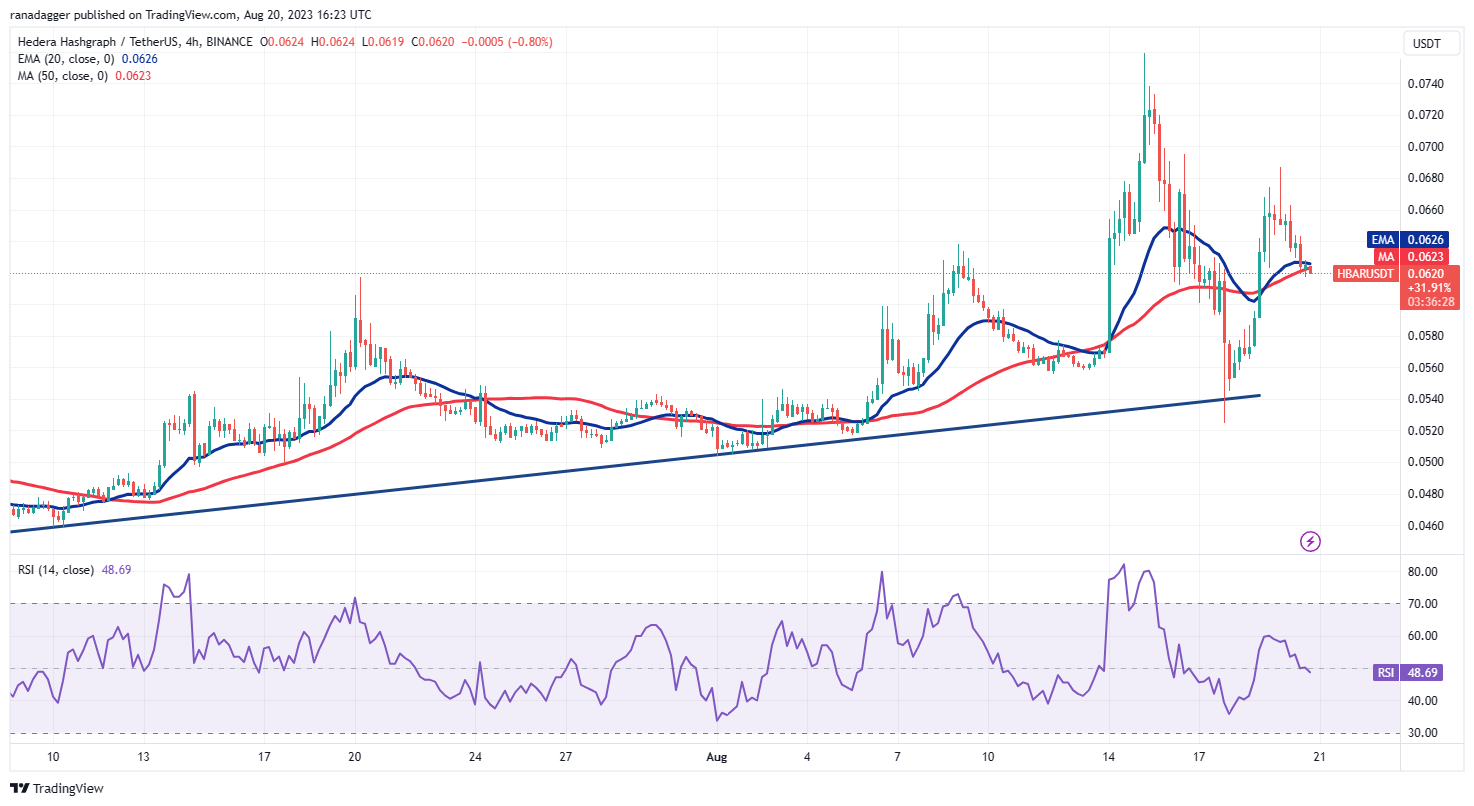
The recovery is facing resistance near the overhead resistance at $0.070. This suggests that the bears have not given up and they continue to sell on rallies. The price has turned down to the moving averages, which is an important level to keep an eye on.
If the price turns up from the current level, it will suggest that the bulls are trying to flip the moving averages into support. Buyers will then make one more attempt to overcome the barrier at $0.070. If they do that, the rally may reach $0.075.
If the price plunges below the moving averages, the pair may collapse to the uptrend line, which is an important level for the bulls to defend.
Optimism price analysis
Optimism (OP) broke below the moving averages but found support at the uptrend line. This suggests demand at lower levels.
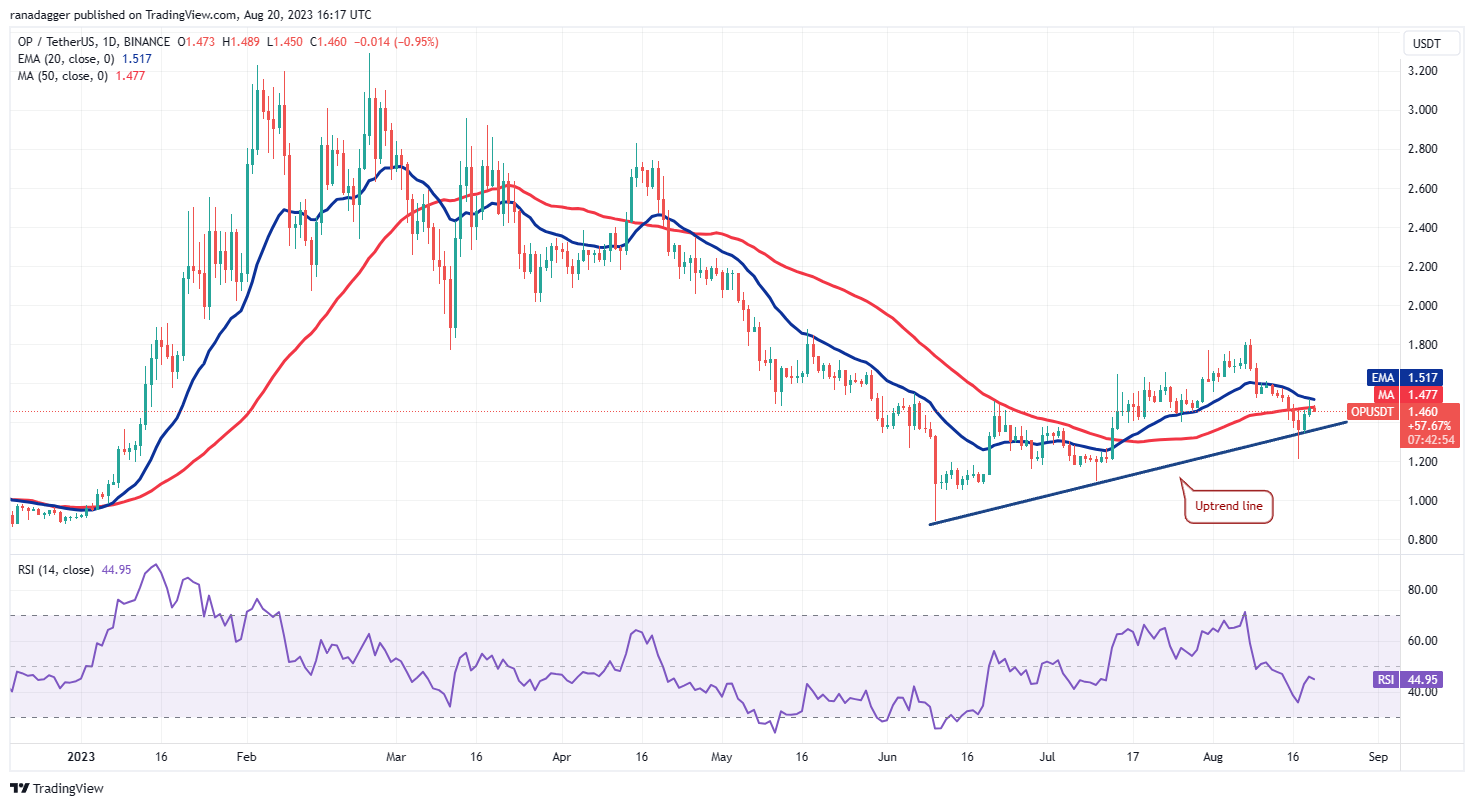
The price has bounced off the uptrend line but is facing resistance at the 20-day EMA ($1.51). If the price does not break below the uptrend line, it will increase the likelihood of a rally above the 20-day EMA. If that happens, the OP/USDT pair may rise to the overhead resistance at $1.88.
Contrary to this assumption, if the price turns down and plummets below the uptrend line, it will suggest that bears have seized control. The pair may first fall to $1.21 and then to $1.09.
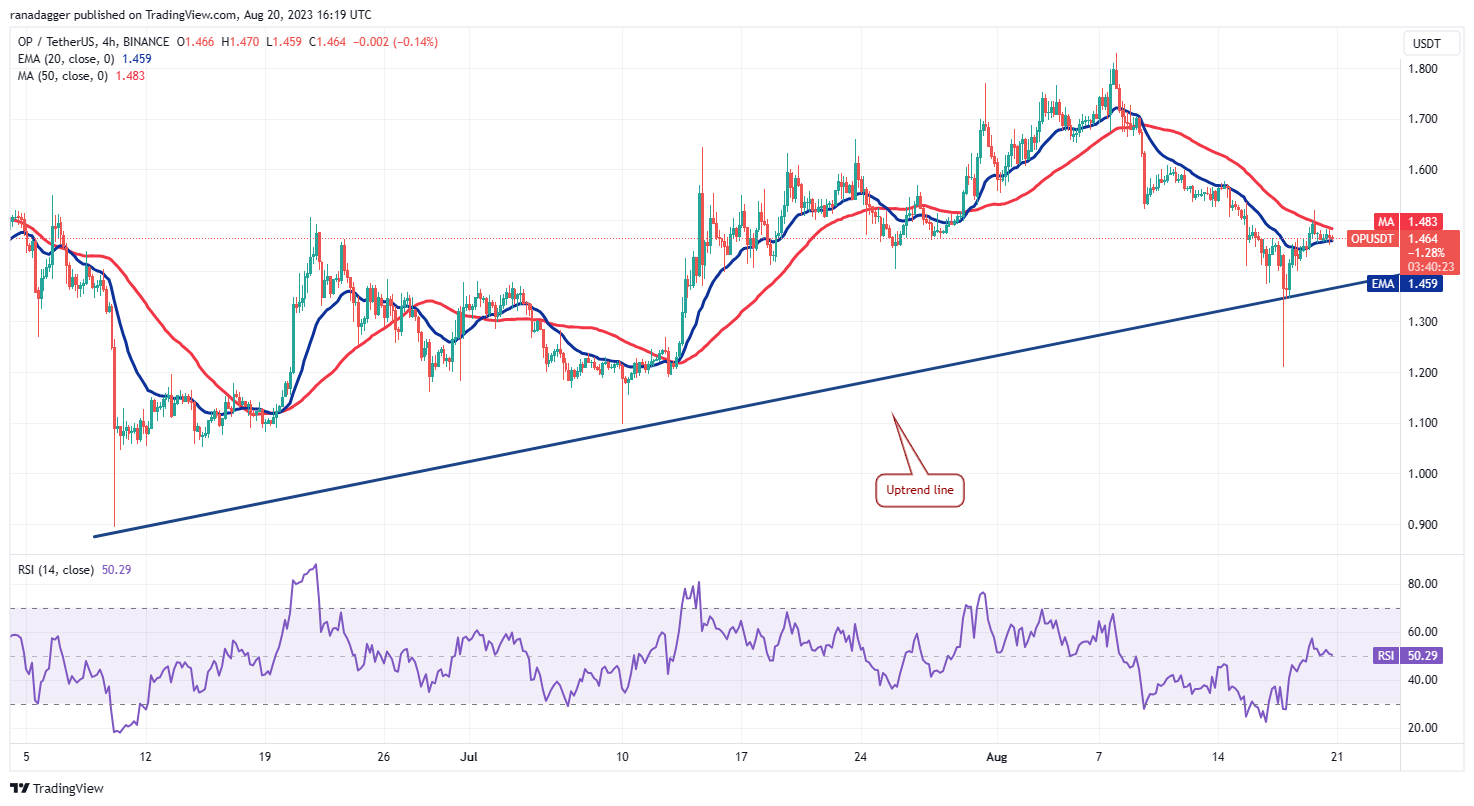
The 4-hour chart shows that the bears are trying to stall the recovery at the 50-SMA. If the price closes below the 20-EMA, the next stop is likely to be the uptrend line. A break below this support could indicate the start of a deeper fall.
Contrary to this assumption, if the price turns up from the current level and breaks above the 50-SMA, it will indicate the start of a relief rally to $1.61. If this level is crossed, the pair could reach $1.71.
Related: Ripple CTO clarifies on SEC appeal, highlights case complexity
Injective price analysis
Injective’s (INJ) price action of the past few days has formed a bullish ascending triangle pattern, indicating that buyers have a slight edge.
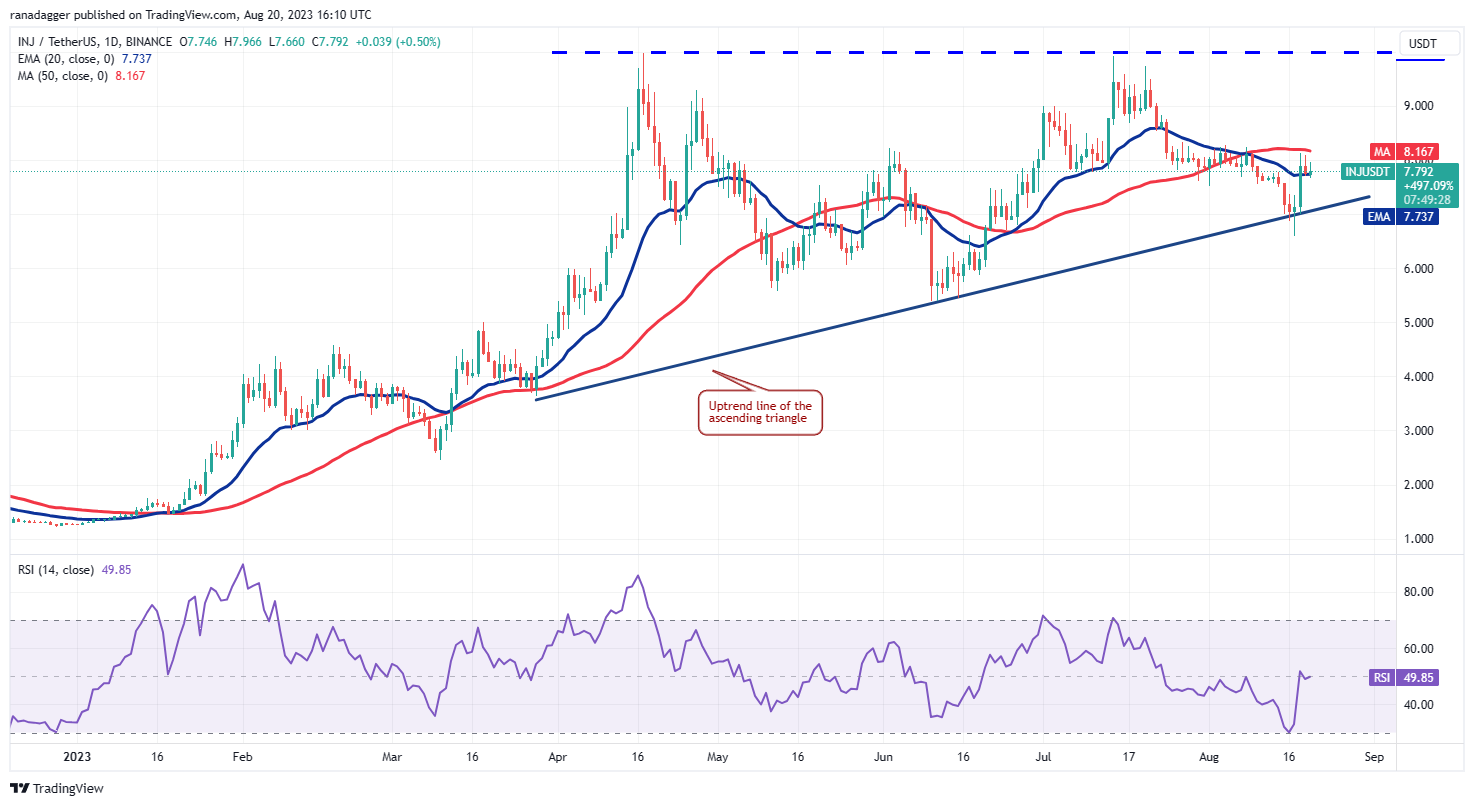
The bears pulled the price below the uptrend line of the triangle on Aug. 17, but the long tail on the candlestick shows solid buying at lower levels. The bulls pushed the price above the 20-day EMA ($7.73) on Aug. 18 and have successfully held the level since then. This suggests that the bulls are trying to flip the 20-day EMA into support.
A rise above the 50-day SMA ($8.16) could signal that the bulls are back in the driver’s seat. That could clear the path for a potential rally to $10. This positive view could invalidate in the near term if the price turns down and breaks below the uptrend line. The INJ/USDT pair may then slump to $5.40.
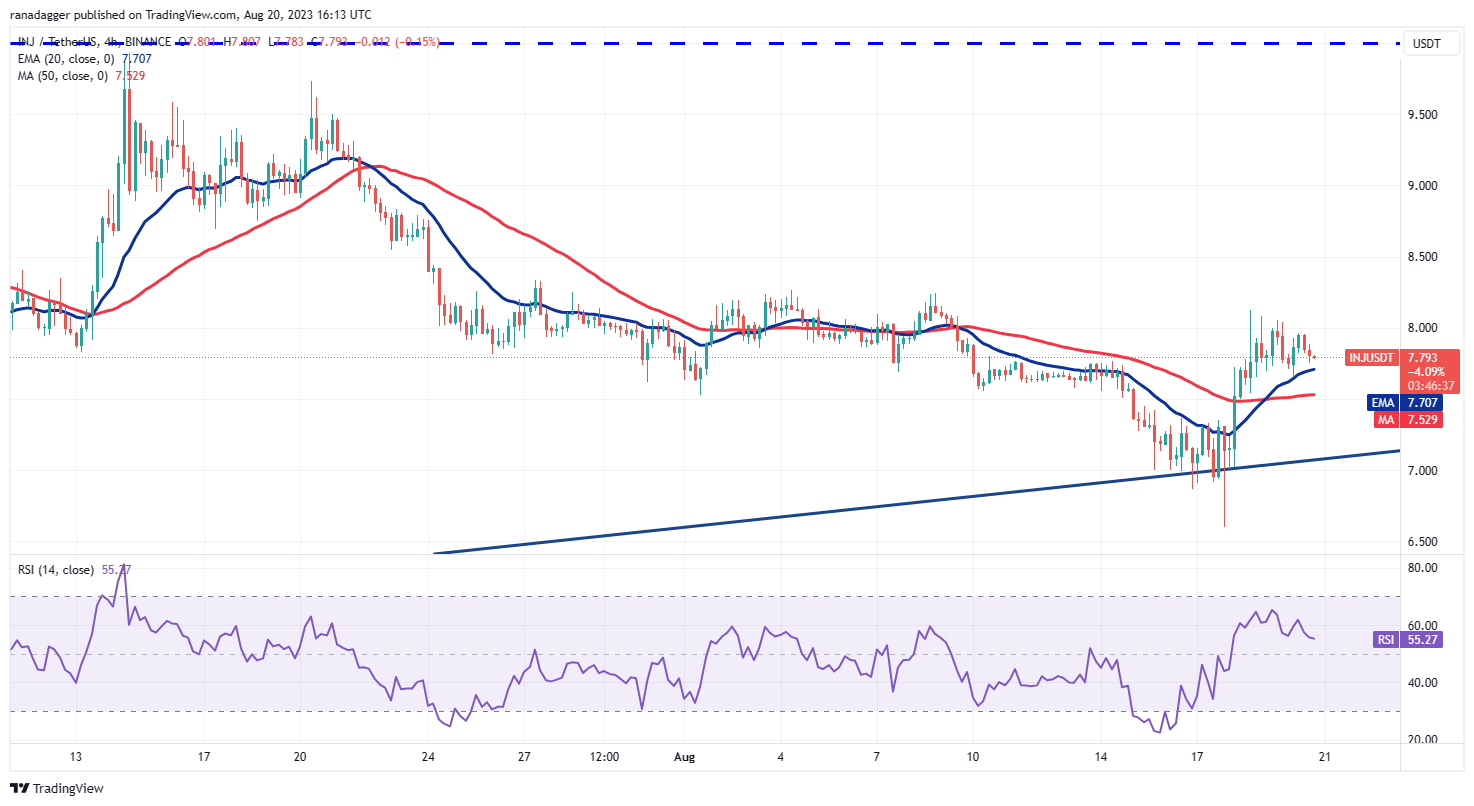
The 4-hour chart shows a strong bounce off the uptrend line, indicating that the bulls are fiercely protecting this level. The recovery is likely to face selling at the overhead resistance at $8.33.
If the price turns down from the current level or the overhead resistance but rebounds off the 20-EMA, it will indicate that bulls continue to buy on dips. That will enhance the prospects of a break above $8.33. If this resistance is cleared, the pair may rise to $8.83 and then to $9.50.
The first sign of weakness will be a break and close below the 50-SMA. That could sink the pair to the crucial level of the uptrend line. If this level cracks, the pair may tumble to $6.50.
THORChain price analysis
While most altcoins are reeling under pressure, THORChain (RUNE) has been in an uptrend for the past few days.
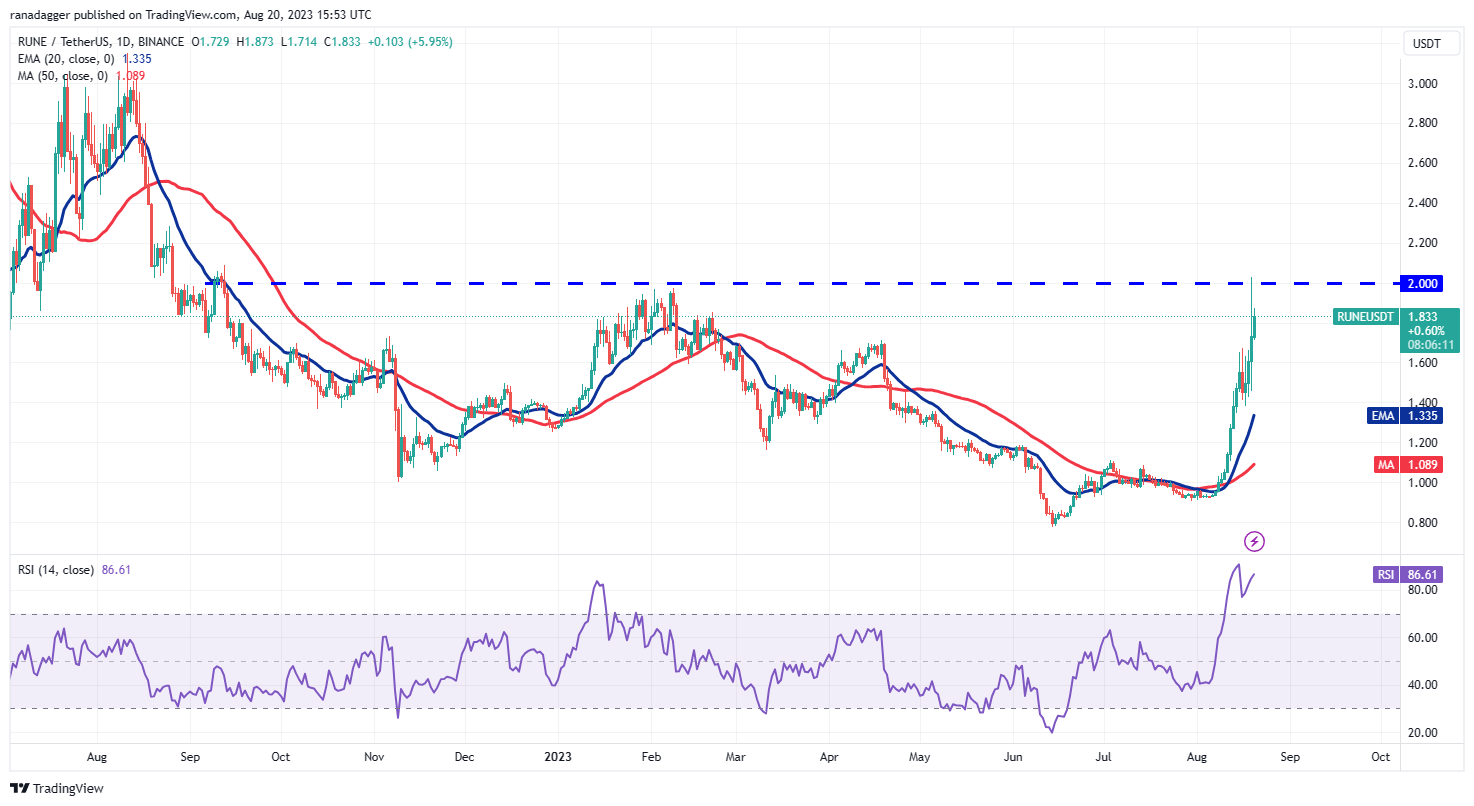
The up-move is facing selling at the overhead resistance at $2 as seen from the long wick on the Aug. 19 candlestick. The sharp rally of the past few days has pushed the RSI into deeply overbought territory, indicating that a consolidation or a minor correction is possible.
If bulls do not give up much ground from the current level, it will increase the possibility of a break above $2. If that happens, the RUNE/USDT pair could start its march toward $2.30 and then $2.60.
Contrarily, if the price dips below $1.41, it will signal the start of a deeper correction to the 20-day EMA ($1.33).
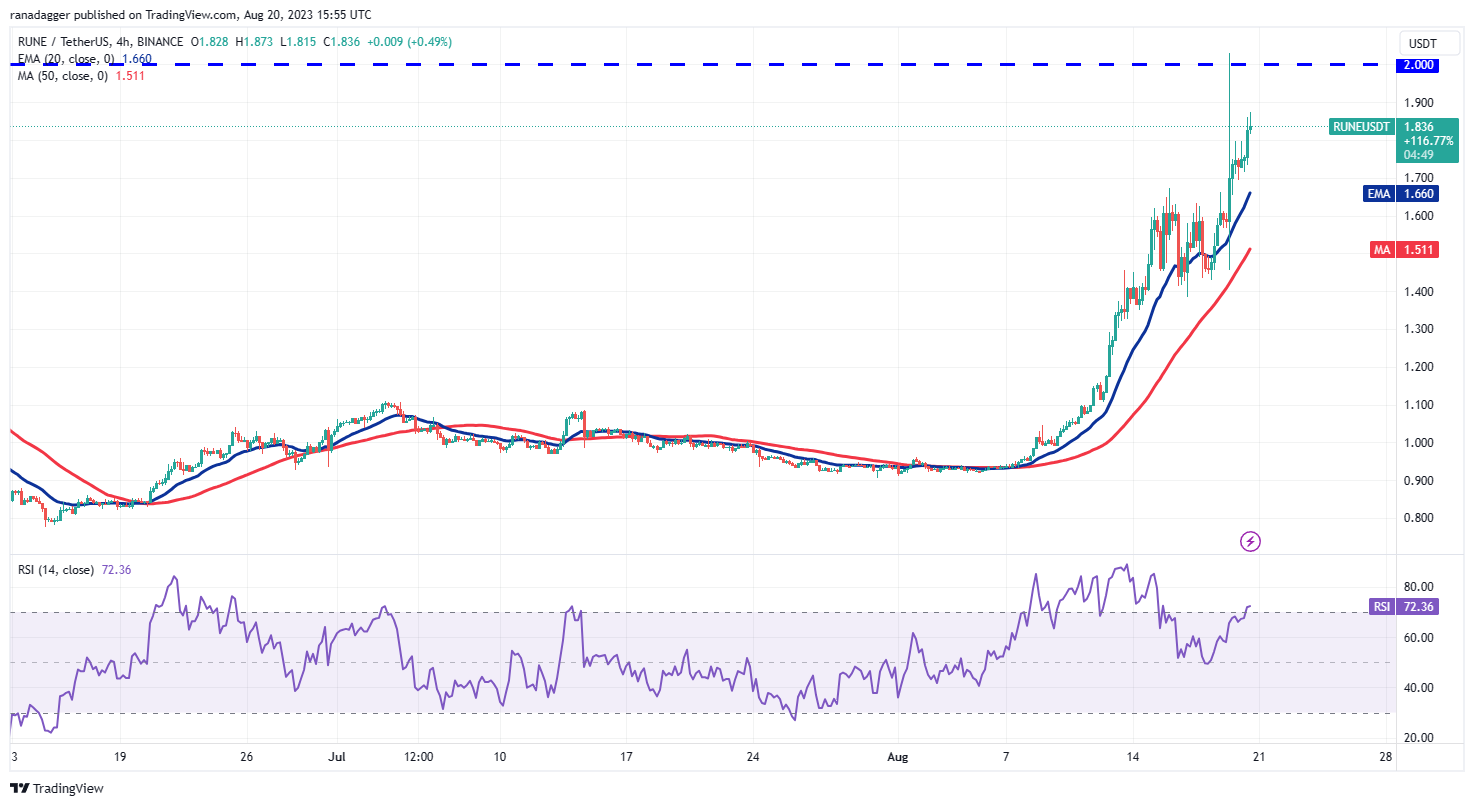
Both moving averages on the 4-hour chart are sloping up and the RSI is in the overbought territory, indicating that bulls have the upper hand. If the price sustains above $1.80, the pair could retest the critical resistance at $2.
Contrarily, if the price skids below $1.80, a drop to the 20-EMA is possible. A strong bounce off this level will indicate that the sentiment remains positive and traders are buying on dips. That will increase the chances of a rally to $2.
If the price breaks below the 20-EMA, it will signal that traders are selling on rallies. That may sink the pair to the 50-SMA and then to $1.38.
This article does not contain investment advice or recommendations. Every investment and trading move involves risk, and readers should conduct their own research when making a decision.


