Key takeaways:
-
Bitcoin price consolidates as resistance at $105,000 prevents rally to new all-time highs.
-
Traders are slightly bearish, but historical data suggests that a sudden bullish move should not be ruled out.
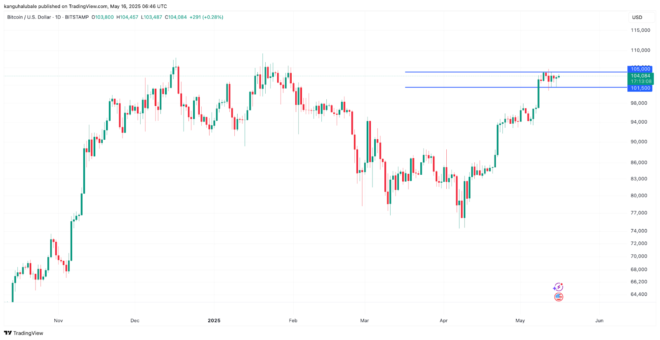
Bitcoin (BTC) price has been consolidating within a roughly $3,500 range over the past seven days as the $105,000 level remains the overhead resistance to break.
Bitcoin unable to crack $105,000
Data from Cointelegraph Markets Pro and Bitstamp shows that BTC’s price has been oscillating between its resistance level at $105,000 and $101,500, where it has found support.
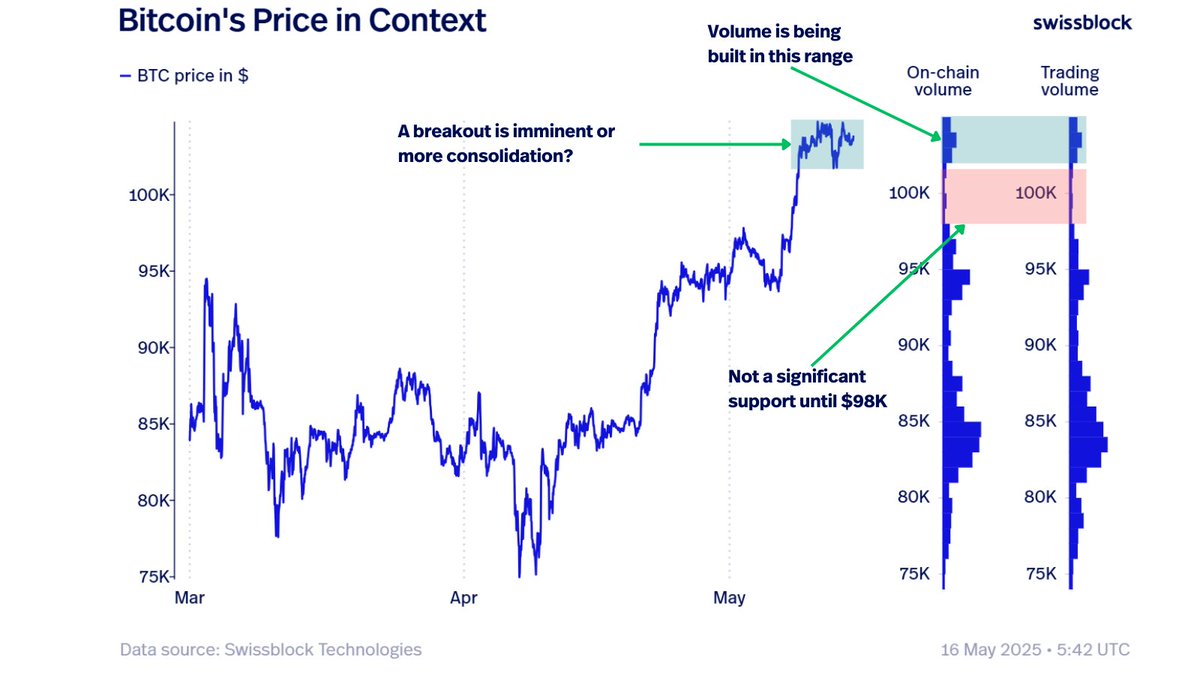
“$BTC is stuck in a narrowing $101.5K–$104K range,” said Swissblock in a May 16 post on X.
The onchain data provider said that Bitcoin began consolidating after two failed attempts to break above the resistance at $105,000.
“With the weekend ahead, resolution will likely be delayed, unless we get a Friday break.”
For market intelligence firm Santiment, failure to grow past the $105,00 level has seen traders flip slightly bearish again.
“Markets generally tend to move opposite to the crowd’s expectations, suggesting there is a heightened probability of crypto markets rising due to this increased fear,” the firm explained in an X post, adding:
“Retail traders are beginning to show impatience, which historically is a bullish sign for prices.”

BTC price lacks “serious catalyst”
Bitcoin has managed to sustain $100,000 as support for over a week while hitting 14-week highs of $105,700 on May 12.
Despite following broad volatility across risk assets, BTC/USD may have gone even higher were it not for maneuvers of large-volume trading entities on exchange order books, according to trading resource Material Indicators.
Related: Bitcoin hitting $220K ‘reasonable’ in 2025, says gold-based forecast
Looking at the Binance exchange, Material Indicators argued that large blocks of ask liquidity were stacked above the spot price, pinning the BTC price in range.
An accompanying chart shows that these liquidity clusters currently sit between $105,000 and $110,000.
“Unless we have a serious catalyst, I’m not expecting to see a sustainable breakout to the all-time high territory until BTC has a legit support test at $100,000,” it summarized in a May 16 post on X.

Material Indicators added that a key level to watch on the downside was the $98,000-$100,000 range.
“With all of the above in mind, be prepared for a support test in the $98,000-$100,000 range, but beware of short squeezes and bull traps until that happens.”
Bitcoin bulls fight to hold key support levels
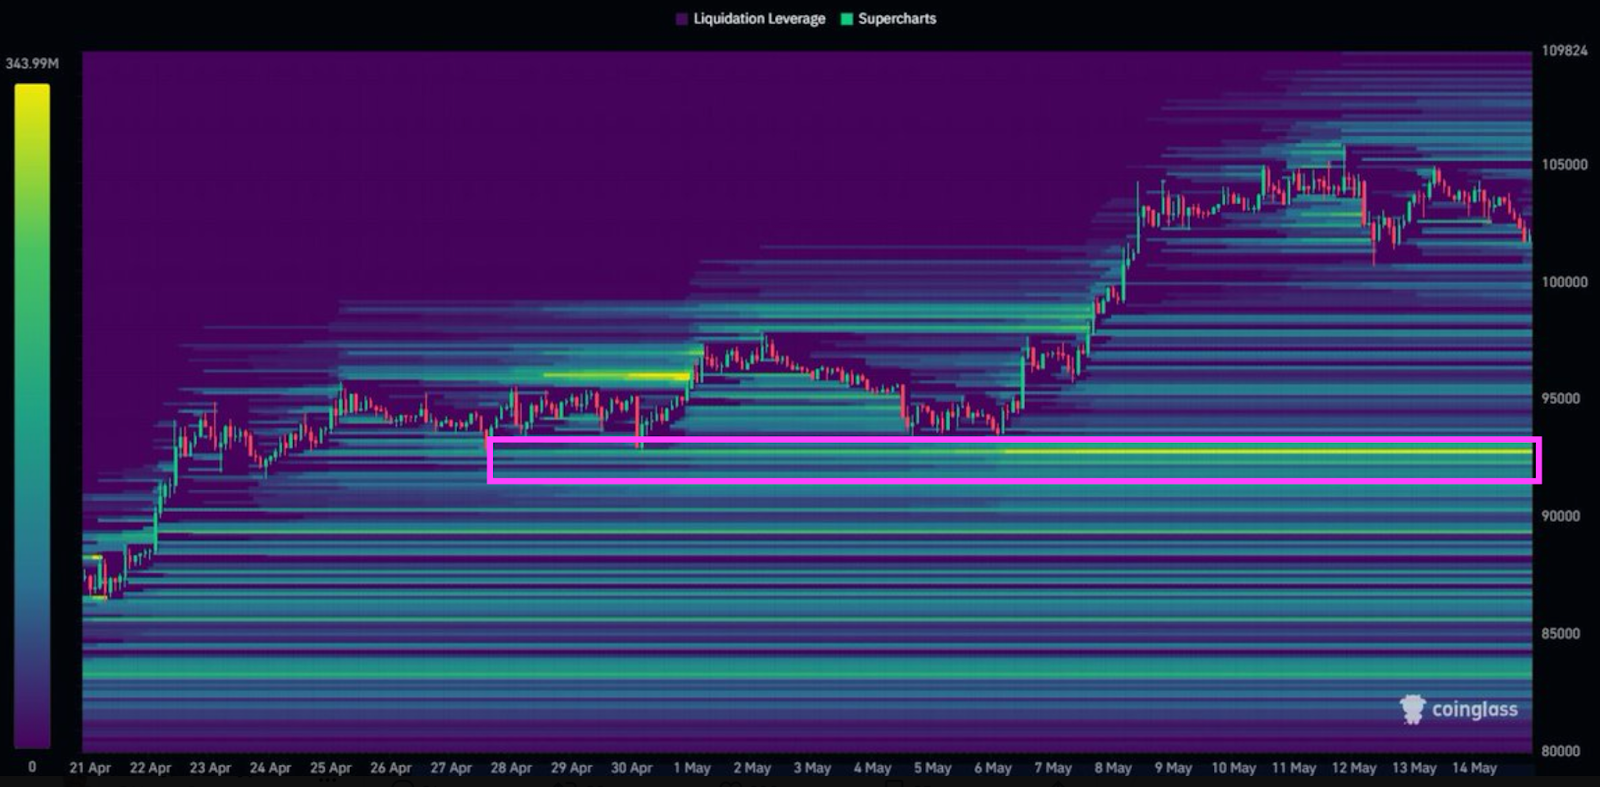
Meanwhile, popular trader Daan Crypto Trades said that the “start of the recent move” at $93,000 was essential for Bitcoin traders going forward.
Bitcoin is trading “far away from any large liquidity clusters. The price didn’t trade for a long time up here just yet. So, after the initial squeeze of shorts, there are not that many new positions built up around this area,” part of his own X post explained, adding:
“The main level to look out for would be local highs above $106,000 and below all the way down to $93,00, which was the start of the recent move.”
Material Indicators meanwhile paid additional attention to the 50-day and 100-day simple moving averages (SMAs), key longer-term trendlines that formed a bullish cross, indicating a “strong upward momentum for the macro trend.”
For MN Capital founder Michael van de Poppe, $98,000 is a “crucial area to hold on to” in order to ensure continuation upward.

This article does not contain investment advice or recommendations. Every investment and trading move involves risk, and readers should conduct their own research when making a decision.