Data shows Bitcoin is losing a major region of on-chain support with its latest plunge. Here’s the range where the next zone lies for the asset.
Bitcoin Has Slipped Under $41,200 To $42,400 Support Region
As explained by analyst Ali in a post on X, BTC has slipped under a key on-chain support zone today. An “on-chain support” range refers to a price below the current spot price of the cryptocurrency that hosts the cost basis of many investors.
For any holder, the cost basis, the price at which they bought their coins, is a fundamental level, as a retest of it by the cryptocurrency can change their profit-loss balance.
Investor psychology works such that if this retest of the cost basis happens from above (meaning that the holder had been carrying profits before this), the holder might react by buying more of the asset because they may believe this same price range could turn out to be profitable again in the future.
On the other hand, any investor who had been in a loss earlier could become likely to sell when the price reaches its break-even mark, as they wouldn’t want to miss out on the opportunity to escape without any losses if the asset happens to drop again shortly.
The individual investors’ reactions aren’t generally relevant to the market as a whole. Still, if many holders show this reaction at once, the combined force can cause fluctuations in the price.
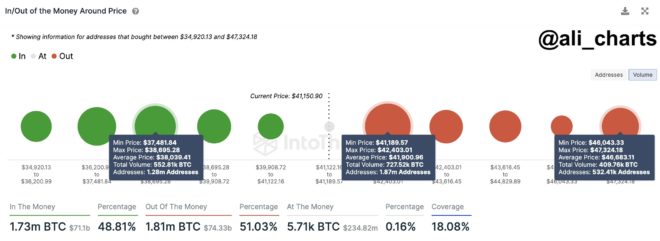
Now, here is a chart that shows what the different price ranges look like for Bitcoin in terms of the number of addresses who bought at them:
Looks like the range around $38,000 is heavy with investors at present | Source: @ali_charts on X
As displayed in the above graph, the Bitcoin range between $41,200 and $42,400 is quite thick with investors. In total, 1.87 million addresses have bought 727,520 BTC at these levels.
Bitcoin has been moving in and out of this crucial support region the past day, suggesting that the zone may weaken. If the range gets lost, BTC might see an extended drop below towards the next major support zone.
The chart shows that the $37,400 to $38,700 range is where substantial on-chain support could next be available, as 1.28 million addresses have their cost basis.
Thus, Bitcoin may be at risk of declining to as low as $38,000 (the average price of the range) shortly. In the potential scenario of such a drawdown, the current $41,200 to $42,400 range could also become resistance, as these addresses would become loss holders desperate to leave.
BTC Price
Bitcoin slipped toward the $40,500 level during the past day but has since recovered to the $41,600 mark. It would appear that the support may not be entirely lost yet.
The price of the coin seems to have gone through a rollercoaster today | Source: BTCUSD on TradingView
Featured image from Kanchanara on Unsplash.com, charts from TradingView.com, IntoTheBlock.com
Disclaimer: The article is provided for educational purposes only. It does not represent the opinions of NewsBTC on whether to buy, sell or hold any investments and naturally investing carries risks. You are advised to conduct your own research before making any investment decisions. Use information provided on this website entirely at your own risk.


