As Bitcoin continues its strong rally, $22,400 could be the level to watch next, if this on-chain metric is anything to go by.
Bitcoin Long-Term Holder Realized Price Is Currently Around $22,400
According to the latest weekly report from Glassnode, BTC broke through all three realized prices of the market back in April 2019. To understand the concept of “realized price,” the realized cap needs to be looked at first. The realized cap is a capitalization model for BTC that values each coin in circulation at the price it was last transacted.
This is different from the usual market cap, which puts the value of all tokens at the same current price of Bitcoin. When the market cap is divided by the total number of coins in circulation, the BTC price is obtained, a fact that isn’t unexpected at all, as the market cap is calculated by multiplying the price by the number of coins to start with.
However, if this same idea is applied to the realized cap (that is if it’s divided by the number of coins), a sort of “realized price” can be derived. The significance of this price is that it’s the cost basis of the average holder in the Bitcoin market.
The implication of this is that if the (normal) price of BTC declines under this realized price, the average investor can be thought to have entered into a state of loss.
All investors in the market can be divided into two major cohorts: the “short-term holders” (STHs) and the “long-term holders” (LTHs). The former includes investors who acquired their coins less than 155 days ago, while the latter consists of holders who have been holding their coins for more than that period.
Now, here is a chart that shows the trend in the realized price for the entire Bitcoin market, as well as that for the STHs and LTHs, over the last five years:
Looks like the value of the crypto has broken past all but one of these metrics | Source: Glassnode The Week Onchain - Week 3, 2023
As shown in the above graph, the BTC price had been below all three of these realized prices for much of the bear market, suggesting that the average Bitcoin investor in all the cohorts was carrying an unrealized loss.
However, in the most recent rally, the crypto has so far managed to break above the STH cost basis ($18,000), as well as that of the entire market ($19,700). The LTH realized price of about $22,400 is yet to be reached by the coin.
A similar rally took place back in April 2019, which marked the end of the 2018-2019 bear market. But in that rally, Bitcoin managed to rise above all three of the realized prices.
If a similar transition is truly taking place in this bear market as well, then the $22,400 level could be the one to watch for next, as a break above it could imply a return towards a bullish regime.
BTC Price
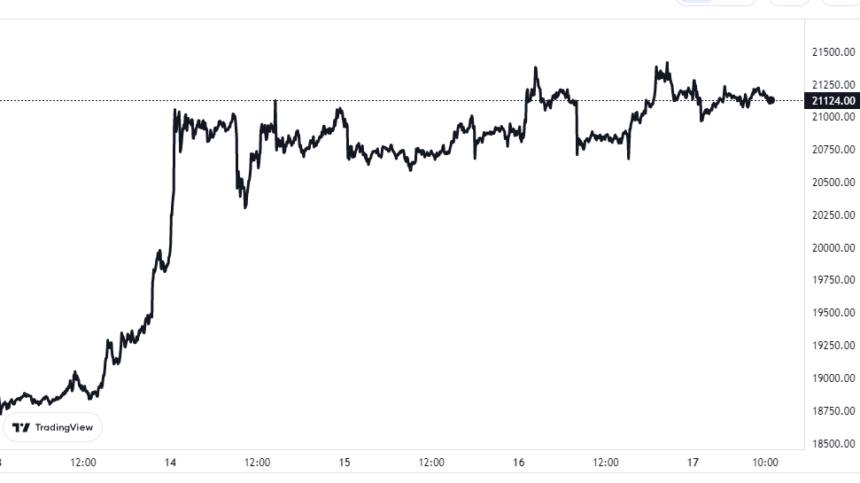
At the time of writing, Bitcoin is trading around $21,100, up 22% in the last week.
BTC continues to move sideways | Source: BTCUSD on TradingView
Featured image from Kanchanara on Unsplash.com, charts from TradingView.com, Glassnode.com


