
Bitcoin price is on track for a monthly decline even as major stock indices like the Dow Jones, Nasdaq 100, and Nifty 50 jumped to record highs.
Bitcoin (BTC) dropped by almost 10% in August, while the Nasdaq 100 index rose by over 2% and gold peaked at an all-time high of $2,530.
This performance occurred despite the US dollar index plunging to $100.1, down by over 6% from its highest point this year. Typically, Bitcoin performs better when the greenback is falling. Notably, it fell even as spot Bitcoin ETFs added a net $188 million in assets.
According to Kaiko, the likely reason for the sell-off is that investors are concerned about the falling liquidity in the Bitcoin market and rising worries that governments will start selling their holdings.
The German government sold its Bitcoin holdings in July, while an analyst recommended that the UK should offload its 61,000 coins to fund its budget. The odds of the UK selling its holdings have increased now that the government has identified a $22 billion hole in its budget.
The other top Bitcoin holders are the United States, China, and Ukraine, which hold 213,246, 190,000, and 46,351 coins, respectively.
Bitcoin spot and futures dropped in August
Additionally, the analysts noted that volumes in the spot and futures markets have been subdued this month. In most periods, cryptocurrencies experience thin volumes when prices are not performing well.
Data from DeFi Llama shows that Decentralized Exchanges handled over $167 billion in volume in August, down from $193 billion the previous month. Another report by CoinMarketCap shows that the volume peaked on August 5 and then resumed its downward trend.
On a positive note, an analyst from Fundstrat mentioned that Bitcoin’s volume tends to bounce back after the Labor Day weekend on Monday, meaning that it may see some more movement in September.
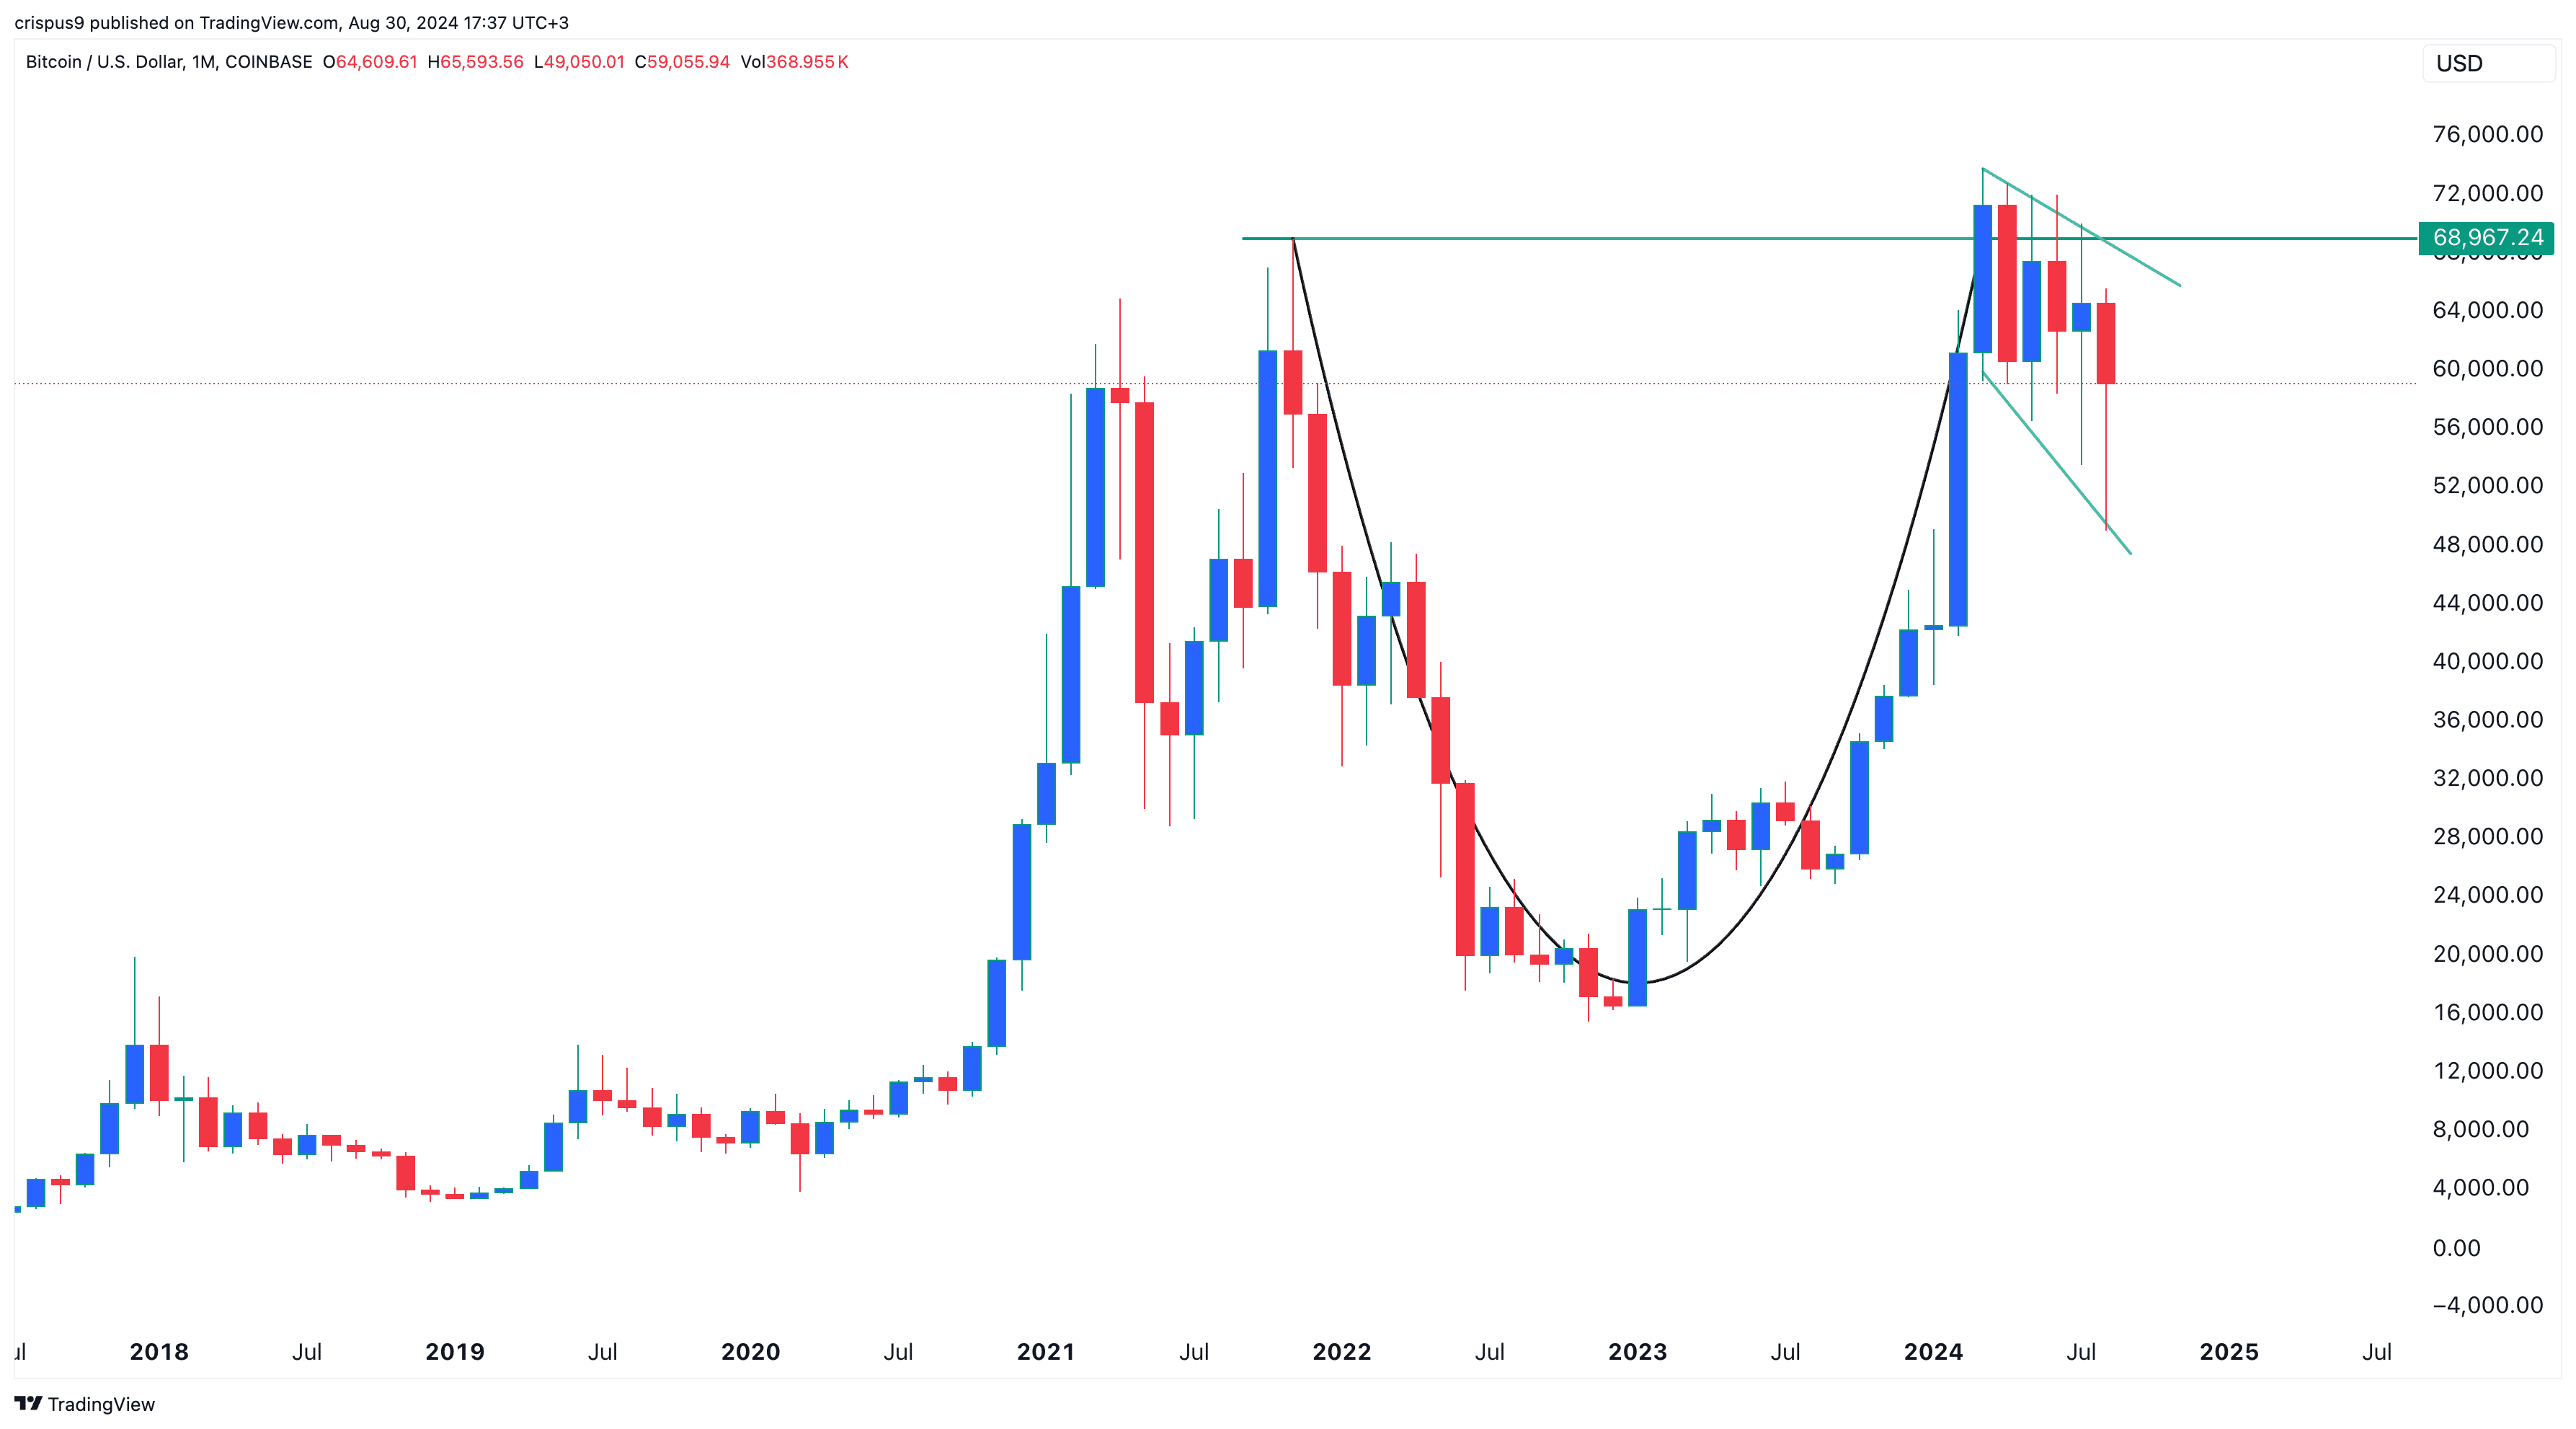
Another positive is that Bitcoin has formed a hammer chart pattern on the monthly chart, indicating a potential rebound. It has also formed a cup and handle pattern, as shown above. Hammer and C&H patterns are some of the most bullish patterns in the market.
However, a key risk is that September has historically been a weak month for Bitcoin. It has dropped in eight of the last eleven Septembers.


